351 Maple Ave Old Saybrook, CT 06475
Estimated Value: $736,465 - $905,000
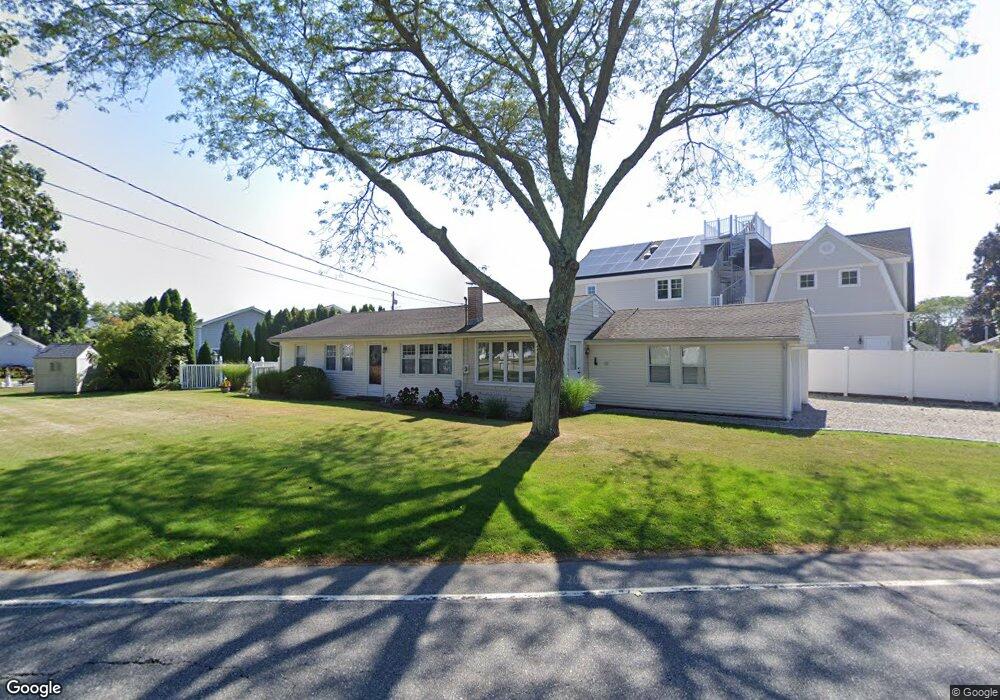
About This Home
This home is located at 351 Maple Ave, Old Saybrook, CT 06475 and is currently estimated at $821,366, approximately $671 per square foot. 351 Maple Ave is a home located in Middlesex County with nearby schools including Kathleen E. Goodwin School, Old Saybrook Middle School, and Old Saybrook Senior High School.
Ownership History
We collect this data history from publicly available records. To have your information removed, we recommend requesting removal directly through your county’s website.
Purchase Details
Home Financials for this Owner
Home Financials are based on the most recent Mortgage that was taken out on this home.Purchase Details
Home Values in the Area
Average Home Value in this Area
Purchase History
We collect this data history from publicly available records. To have your information removed, we recommend requesting removal directly through your county’s website.
| Date | Buyer | Sale Price | Title Company |
|---|---|---|---|
| -- | None Available | ||
| -- | None Available | ||
| $120,000 | -- |
Mortgage History
We collect this data history from publicly available records. To have your information removed, we recommend requesting removal directly through your county’s website.
| Date | Status | Borrower | Loan Amount |
|---|---|---|---|
| Previous Owner | $114,494 | ||
| Previous Owner | $25,000 |
Tax History
We collect this data history from publicly available records. To have your information removed, we recommend requesting removal directly through your county’s website.
| Year | Tax Paid | Tax Assessment Tax Assessment Total Assessment is a certain percentage of the fair market value that is determined by local assessors to be the total taxable value of land and additions on the property. | Land | Improvement |
|---|---|---|---|---|
| 2025 | $5,307 | $342,400 | $195,400 | $147,000 |
| 2024 | $5,204 | $342,400 | $195,400 | $147,000 |
| 2023 | $4,732 | $231,400 | $129,300 | $102,100 |
| 2022 | $4,647 | $231,400 | $129,300 | $102,100 |
| 2021 | $4,640 | $231,400 | $129,300 | $102,100 |
| 2020 | $4,640 | $231,400 | $129,300 | $102,100 |
| 2019 | $4,570 | $231,400 | $129,300 | $102,100 |
| 2018 | $4,537 | $231,500 | $138,300 | $93,200 |
| 2017 | $4,551 | $231,500 | $138,300 | $93,200 |
| 2016 | $4,459 | $231,500 | $138,300 | $93,200 |
| 2015 | $4,355 | $231,500 | $138,300 | $93,200 |
| 2014 | $4,283 | $231,500 | $138,300 | $93,200 |
Map
- 5 Woodland Dr
- 24 Seabreeze Rd
- 37 Woodland Dr
- 43 Indianola Dr
- 24 W Shore Dr
- 11 Cambridge Ct E
- 13 Briarwood Dr
- 21 Fenbrook Rd
- 104 Knollwood Dr
- 86 Fenwood Dr
- 96 Fenwood Dr
- 108 Maple Ave
- 6 Fencove Ct
- 95 Middletown Ave
- 25 River Ave
- 9 Farview Ave
- 39 Middletown Ave
- 129 Old Boston Post Rd
- 18 Old South Cove Rd
- 25 Sunset Rd Unit 3
Ask me questions while you tour the home.