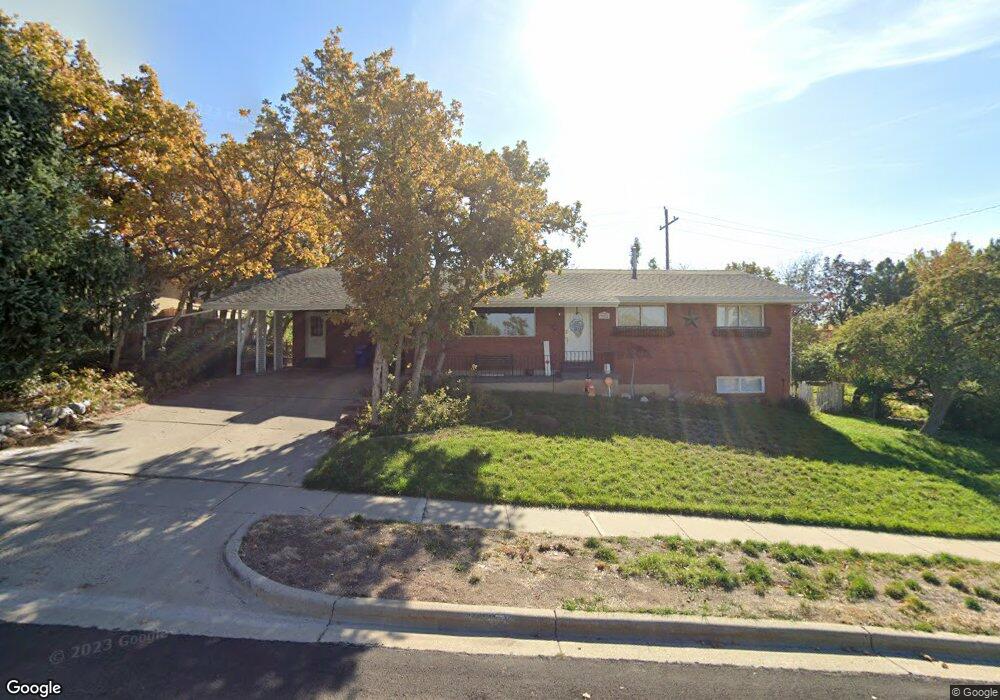
352 E 2100 S Bountiful, UT 84010
Estimated Value: $612,000 - $739,000
4
Beds
3
Baths
3,200
Sq Ft
$206/Sq Ft
Est. Value
About This Home
This home is located at 352 E 2100 S, Bountiful, UT 84010 and is currently estimated at $659,168, approximately $205 per square foot. 352 E 2100 S is a home located in Davis County with nearby schools including Muir School, Mueller Park Junior High School, and Bountiful High School.
Ownership History
Date
Name
Owned For
Owner Type
Purchase Details
Closed on
Jun 30, 2021
Sold by
Thompson Michael Clyde and The Thompson Family Trust
Bought by
Crawford Samantha N and Crawford Sean
Current Estimated Value
Home Financials for this Owner
Home Financials are based on the most recent Mortgage that was taken out on this home.
Original Mortgage
$503,500
Outstanding Balance
$455,857
Interest Rate
2.9%
Mortgage Type
New Conventional
Estimated Equity
$203,312
Purchase Details
Closed on
Apr 12, 2021
Sold by
Thompson Clyde Keith
Bought by
Thompson Family Trust and Thompson
Create a Home Valuation Report for This Property
The Home Valuation Report is an in-depth analysis detailing your home's value as well as a comparison with similar homes in the area
Purchase History
| Date | Buyer | Sale Price | Title Company |
|---|---|---|---|
| Crawford Samantha N | -- | Aspen Title Insurance | |
| Thompson Family Trust | -- | -- |
Source: Public Records
Mortgage History
| Date | Status | Borrower | Loan Amount |
|---|---|---|---|
| Open | Crawford Samantha N | $503,500 |
Source: Public Records
Tax History
| Year | Tax Paid | Tax Assessment Tax Assessment Total Assessment is a certain percentage of the fair market value that is determined by local assessors to be the total taxable value of land and additions on the property. | Land | Improvement |
|---|---|---|---|---|
| 2025 | $3,344 | $305,250 | $134,765 | $170,485 |
| 2024 | $3,119 | $294,800 | $121,155 | $173,645 |
| 2023 | $2,993 | $513,000 | $222,245 | $290,755 |
| 2022 | $3,152 | $297,000 | $121,182 | $175,818 |
| 2021 | $2,629 | $377,000 | $157,390 | $219,610 |
| 2020 | $2,330 | $335,000 | $134,191 | $200,809 |
| 2019 | $2,369 | $333,000 | $139,998 | $193,002 |
| 2018 | $2,207 | $305,000 | $135,057 | $169,943 |
| 2016 | $1,901 | $142,175 | $51,276 | $90,899 |
| 2015 | $1,849 | $130,515 | $51,276 | $79,239 |
| 2014 | $1,818 | $132,033 | $51,276 | $80,757 |
| 2013 | -- | $110,227 | $51,700 | $58,527 |
Source: Public Records
Map
Nearby Homes
- 320 E 2100 S
- 2053 S 350 E Unit 7
- 2046 S 350 E Unit 4
- 295 E 2050 S Unit 1
- 2038 S 350 E Unit 3
- 296 E 2050 S Unit 2
- 2059 S 350 E Unit 6
- 2273 S 200 E
- 2292 S 250 E
- 188 E 2050 S Unit D3
- 1886 S Jeri Dr
- 110 2250 S
- 1885 Spring Creek Dr
- 2064 S Orchard Dr
- 41 E 2200 S
- 2 E Wicker Ln
- 69 E North Canyon Rd
- 761 San Simeon Way
- 19 E North Canyon Rd
- 631 E 1700 S
Your Personal Tour Guide
Ask me questions while you tour the home.