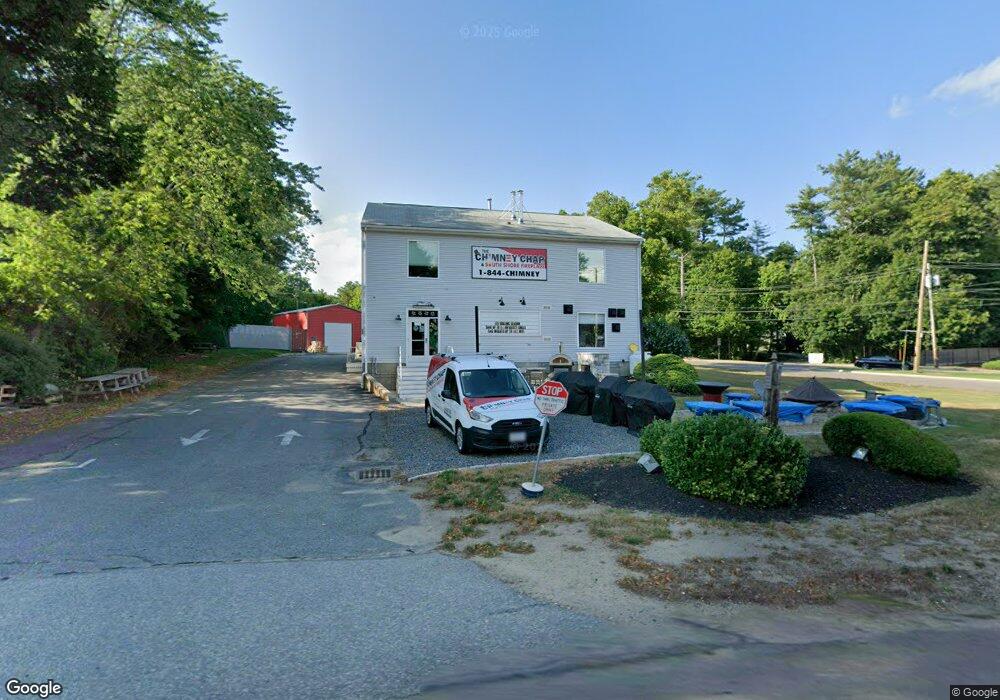
352 Main St Unit 2 Hanson, MA 02341
2
Beds
1
Bath
900
Sq Ft
0.86
Acres Lot
About This Home
This home is located at 352 Main St Unit 2, Hanson, MA 02341. 352 Main St Unit 2 is a home located in Plymouth County.
Ownership History
Date
Name
Owned For
Owner Type
Purchase Details
Closed on
Mar 12, 2021
Sold by
Hansen Ft and Hansen
Bought by
Sarras Holdings Llc
Home Financials for this Owner
Home Financials are based on the most recent Mortgage that was taken out on this home.
Original Mortgage
$637,500
Outstanding Balance
$568,871
Interest Rate
2.7%
Mortgage Type
Purchase Money Mortgage
Purchase Details
Closed on
Jan 14, 2013
Sold by
Hansen Ronald J and Hansen Margaret E
Bought by
Hansen Ft
Purchase Details
Closed on
Jun 1, 1990
Sold by
Gronlund Rt
Bought by
Hansen Ronald J
Create a Home Valuation Report for This Property
The Home Valuation Report is an in-depth analysis detailing your home's value as well as a comparison with similar homes in the area
Home Values in the Area
Average Home Value in this Area
Purchase History
We collect this data history from publicly available records. To have your information removed, we recommend requesting removal directly through your county’s website.
| Date | Buyer | Sale Price | Title Company |
|---|---|---|---|
| Sarras Holdings Llc | $630,000 | None Available | |
| Hansen Ft | -- | -- | |
| Hansen Ft | -- | -- | |
| Hansen Ronald J | $161,000 | -- |
Source: Public Records
Mortgage History
We collect this data history from publicly available records. To have your information removed, we recommend requesting removal directly through your county’s website.
| Date | Status | Borrower | Loan Amount |
|---|---|---|---|
| Open | Sarras Holdings Llc | $637,500 | |
| Previous Owner | Hansen Ronald J | $562,500 | |
| Previous Owner | Hansen Ronald J | $425,000 |
Source: Public Records
Tax History
| Year | Tax Paid | Tax Assessment Tax Assessment Total Assessment is a certain percentage of the fair market value that is determined by local assessors to be the total taxable value of land and additions on the property. | Land | Improvement |
|---|---|---|---|---|
| 2025 | $12,492 | $933,600 | $203,500 | $730,100 |
| 2024 | $12,093 | $903,800 | $197,500 | $706,300 |
| 2023 | $9,961 | $702,500 | $188,200 | $514,300 |
| 2022 | $9,187 | $608,800 | $181,000 | $427,800 |
| 2021 | $8,522 | $564,400 | $175,700 | $388,700 |
| 2020 | $8,418 | $551,300 | $172,300 | $379,000 |
| 2019 | $8,155 | $525,100 | $168,500 | $356,600 |
| 2018 | $8,146 | $514,600 | $166,000 | $348,600 |
| 2017 | $7,217 | $451,600 | $162,700 | $288,900 |
| 2016 | $7,308 | $441,600 | $162,700 | $278,900 |
| 2015 | $6,927 | $435,100 | $162,700 | $272,400 |
Source: Public Records
Map
Nearby Homes
Your Personal Tour Guide
Ask me questions while you tour the home.