352 South St Foxboro, MA 02035
Estimated Value: $581,000 - $601,000
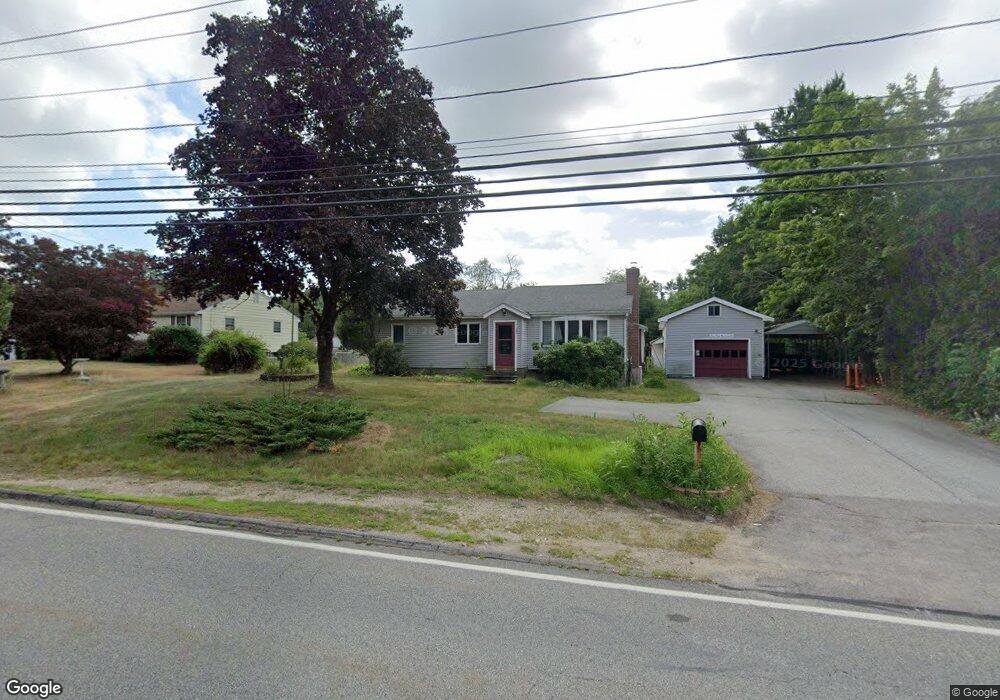
About This Home
This home is located at 352 South St, Foxboro, MA 02035 and is currently estimated at $586,940, approximately $457 per square foot. 352 South St is a home located in Norfolk County with nearby schools including Foxborough High School, Foxborough Regional Charter School, and Discovery Daycare Center.
Ownership History
We collect this data history from publicly available records. To have your information removed, we recommend requesting removal directly through your county’s website.
Purchase Details
Purchase Details
Purchase Details
Home Values in the Area
Average Home Value in this Area
Purchase History
We collect this data history from publicly available records. To have your information removed, we recommend requesting removal directly through your county’s website.
| Date | Buyer | Sale Price | Title Company |
|---|---|---|---|
| -- | -- | ||
| -- | -- | ||
| -- | -- | ||
| -- | -- |
Mortgage History
We collect this data history from publicly available records. To have your information removed, we recommend requesting removal directly through your county’s website.
| Date | Status | Borrower | Loan Amount |
|---|---|---|---|
| Previous Owner | $65,000 |
Tax History
We collect this data history from publicly available records. To have your information removed, we recommend requesting removal directly through your county’s website.
| Year | Tax Paid | Tax Assessment Tax Assessment Total Assessment is a certain percentage of the fair market value that is determined by local assessors to be the total taxable value of land and additions on the property. | Land | Improvement |
|---|---|---|---|---|
| 2025 | $6,069 | $459,100 | $195,500 | $263,600 |
| 2024 | $5,917 | $438,000 | $210,800 | $227,200 |
| 2023 | $5,464 | $384,500 | $200,700 | $183,800 |
| 2022 | $5,406 | $372,300 | $179,900 | $192,400 |
| 2021 | $5,216 | $353,900 | $170,900 | $183,000 |
| 2020 | $4,955 | $340,100 | $170,900 | $169,200 |
| 2019 | $4,967 | $337,900 | $171,300 | $166,600 |
| 2018 | $4,706 | $323,000 | $162,700 | $160,300 |
| 2017 | $4,617 | $307,000 | $160,100 | $146,900 |
| 2016 | $4,520 | $305,000 | $154,000 | $151,000 |
| 2015 | $4,086 | $269,000 | $114,800 | $154,200 |
| 2014 | $4,079 | $272,100 | $114,800 | $157,300 |
Map
- 401 South St
- 38 West St
- 26 Fairway Ln
- 8 Bicknell St
- 9 Green St
- 139 Grove St
- 116 S High St
- 40 Treasure Island Rd
- 8 Douglas Dr
- 26 Pinto Way
- 483 Thurston St
- 356 Central St
- 9 Oak Dr
- 226 Central St
- 380 Central St
- 1 King Philip Cir Unit Lot 6
- 14 Lancelot Ln
- 6 Harness Path
- 84 Messenger St
- 9 Orchard Place Unit 9
Ask me questions while you tour the home.