353 E 400 S Valparaiso, IN 46383
Porter County NeighborhoodEstimated Value: $295,000 - $381,000
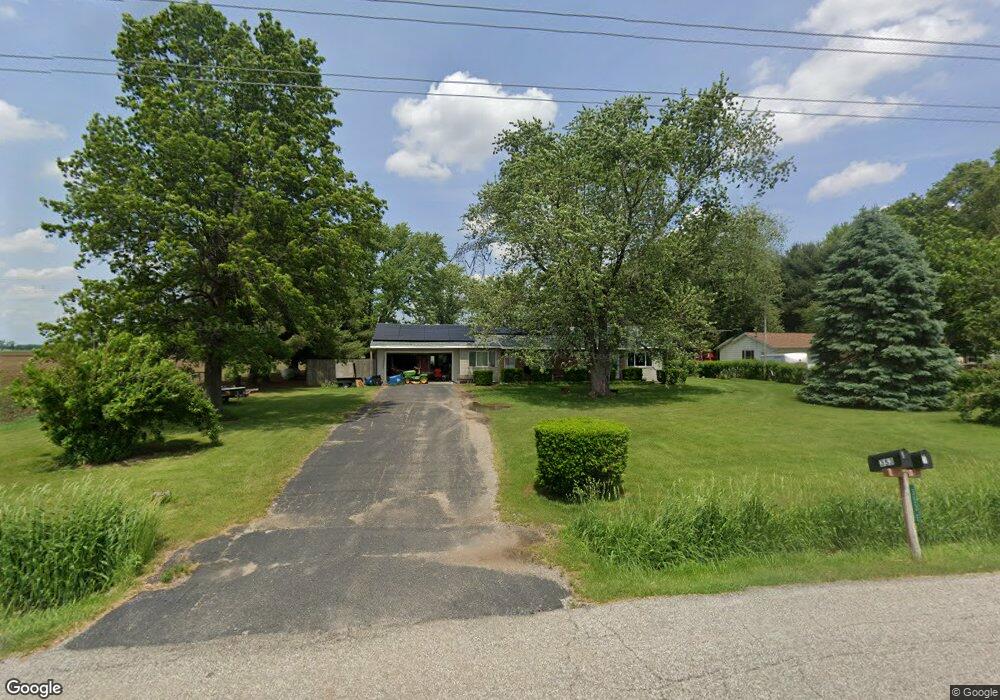
About This Home
This home is located at 353 E 400 S, Valparaiso, IN 46383 and is currently estimated at $319,568, approximately $165 per square foot. 353 E 400 S is a home located in Porter County with nearby schools including Morgan Township Elementary School and Morgan Township Middle/High School.
Ownership History
We collect this data history from publicly available records. To have your information removed, we recommend requesting removal directly through your county’s website.
Purchase Details
Home Financials for this Owner
Home Financials are based on the most recent Mortgage that was taken out on this home.Home Values in the Area
Average Home Value in this Area
Purchase History
We collect this data history from publicly available records. To have your information removed, we recommend requesting removal directly through your county’s website.
| Date | Buyer | Sale Price | Title Company |
|---|---|---|---|
| -- | Transtar National Title |
Mortgage History
We collect this data history from publicly available records. To have your information removed, we recommend requesting removal directly through your county’s website.
| Date | Status | Borrower | Loan Amount |
|---|---|---|---|
| Open | $97,500 |
Tax History
We collect this data history from publicly available records. To have your information removed, we recommend requesting removal directly through your county’s website.
| Year | Tax Paid | Tax Assessment Tax Assessment Total Assessment is a certain percentage of the fair market value that is determined by local assessors to be the total taxable value of land and additions on the property. | Land | Improvement |
|---|---|---|---|---|
| 2025 | $3,604 | $286,700 | $65,200 | $221,500 |
| 2024 | $1,775 | $292,500 | $39,300 | $253,200 |
| 2023 | $3,472 | $260,800 | $34,500 | $226,300 |
| 2022 | $3,312 | $234,400 | $34,500 | $199,900 |
| 2021 | $3,223 | $207,200 | $34,500 | $172,700 |
| 2020 | $3,135 | $199,500 | $30,000 | $169,500 |
| 2019 | $3,006 | $184,400 | $30,000 | $154,400 |
| 2018 | $2,804 | $175,700 | $30,000 | $145,700 |
| 2017 | $2,895 | $174,200 | $30,000 | $144,200 |
| 2016 | $2,499 | $163,300 | $30,700 | $132,600 |
| 2014 | $2,345 | $144,000 | $29,700 | $114,300 |
| 2013 | -- | $136,500 | $30,000 | $106,500 |
Map
- 6775 E 103rd Ln
- 373 S State Road 49
- 243 S 150 E
- 191 E 112 S
- 421 Amy Rose Ln
- 35 Oak Hollow Ct
- 303 Pinehurst Ct
- 414 N Church St
- 147 E 50 S
- Lot 2 State Route 49
- Lot 1 State Route 49
- Tbd E Division Rd
- 351 S 100 W
- Lot B4-5 St Road 8
- 715 Vanessa Way
- 0 Vanessa Way Unit GNR544729
- 0 Sharyn St Unit GNR544743
- 0 Sharyn St Unit GNR544737
- 0 Sharyn St Unit GNR544741
- 708 S Main St
Ask me questions while you tour the home.