353 Maple St Springfield, MA 01105
Maple-High Six Corners NeighborhoodAbout This Home
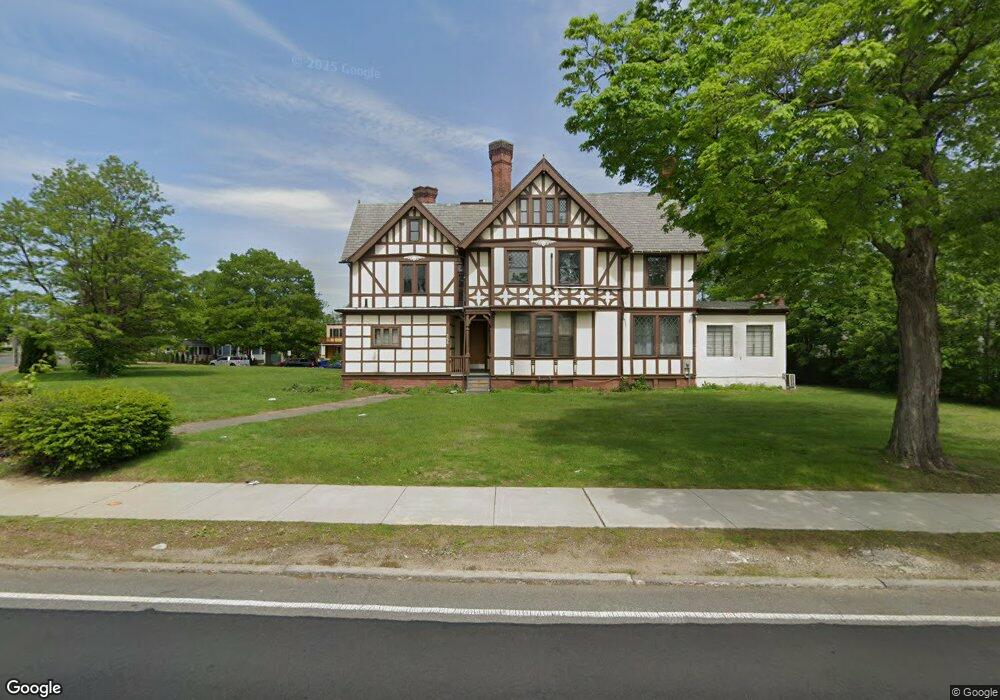
This home is located at 353 Maple St, Springfield, MA 01105. 353 Maple St is a home located in Hampden County with nearby schools including Milton Bradley School, South End Middle School, and High School Of Commerce.
Ownership History
We collect this data history from publicly available records. To have your information removed, we recommend requesting removal directly through your county’s website.
Purchase Details
Home Financials for this Owner
Home Financials are based on the most recent Mortgage that was taken out on this home.Home Values in the Area
Average Home Value in this Area
Purchase History
We collect this data history from publicly available records. To have your information removed, we recommend requesting removal directly through your county’s website.
| Date | Buyer | Sale Price | Title Company |
|---|---|---|---|
| $200,000 | -- |
Mortgage History
We collect this data history from publicly available records. To have your information removed, we recommend requesting removal directly through your county’s website.
| Date | Status | Borrower | Loan Amount |
|---|---|---|---|
| Open | $314,000 | ||
| Previous Owner | $85,000 | ||
| Previous Owner | $90,000 |
Tax History
We collect this data history from publicly available records. To have your information removed, we recommend requesting removal directly through your county’s website.
| Year | Tax Paid | Tax Assessment Tax Assessment Total Assessment is a certain percentage of the fair market value that is determined by local assessors to be the total taxable value of land and additions on the property. | Land | Improvement |
|---|---|---|---|---|
| 2025 | -- | $343,100 | $31,100 | $312,000 |
| 2024 | -- | $318,000 | $29,100 | $288,900 |
| 2023 | $0 | $277,400 | $27,700 | $249,700 |
| 2022 | $0 | $319,100 | $25,400 | $293,700 |
| 2021 | $0 | $302,100 | $23,000 | $279,100 |
| 2020 | $0 | $253,000 | $23,000 | $230,000 |
| 2019 | $0 | $245,800 | $23,000 | $222,800 |
| 2018 | $0 | $232,300 | $23,000 | $209,300 |
| 2017 | $0 | $215,400 | $18,500 | $196,900 |
| 2016 | -- | $197,100 | $18,500 | $178,600 |
| 2015 | -- | $197,100 | $18,500 | $178,600 |
Map
- 270 Maple St
- 35-37 Pine Street Ct
- 415 Maple St
- WS Maple St
- SS Maple St
- 243 Central St
- 108 Marble St
- 229 Central St
- 236-240 Locust St
- 52 Acushnet Ave
- 48 Acushnet Ave Unit 50
- 32 Wendell Place
- 120 Central St
- 48 Madison Ave
- 18 Wendell Place
- 570-582 Main St
- 122 Bellevue Ave
- 146 Bellevue Ave
- 27 Loring St
- 27 Chester St
- 310 Pine St
- 327 Maple St
- 327 Maple St Unit In-Law
- 346 Maple St Unit 356
- 346-356 Maple St
- 53 George St
- 279 Pine St
- 37 George St
- 313 Maple St
- 313 Maple St Unit Carriage
- 280 Pine St Unit 282
- 275 Pine St
- 271 Pine St
- 11 Crescent Hill
- 360 Maple St
- 1 Crescent Hill
- 29 George St
- 278 Pine St
- 16 Dexter St
- 0 Windsor St
Ask me questions while you tour the home.