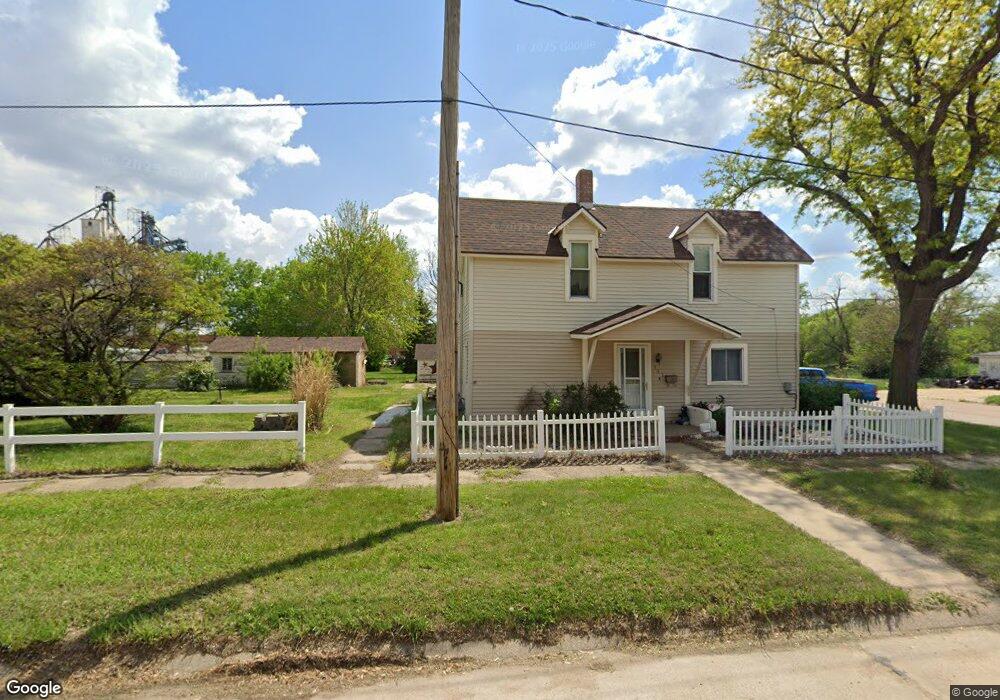
353 W 3rd St Superior, NE 68978
Estimated Value: $95,657 - $133,000
5
Beds
1
Bath
1,718
Sq Ft
$66/Sq Ft
Est. Value
About This Home
This home is located at 353 W 3rd St, Superior, NE 68978 and is currently estimated at $112,914, approximately $65 per square foot. 353 W 3rd St is a home located in Nuckolls County with nearby schools including Superior Elementary School and Superior Middle/High School.
Ownership History
Date
Name
Owned For
Owner Type
Purchase Details
Closed on
Jun 30, 2025
Sold by
Nondorf Larry A
Bought by
Nondorf Austin and Nondorf Tierra
Current Estimated Value
Purchase Details
Closed on
Jan 26, 2023
Sold by
Nondorf Larry A
Bought by
Nondorf Larry A and Johal Bonnie S
Create a Home Valuation Report for This Property
The Home Valuation Report is an in-depth analysis detailing your home's value as well as a comparison with similar homes in the area
Purchase History
| Date | Buyer | Sale Price | Title Company |
|---|---|---|---|
| Nondorf Austin | $9,000 | None Listed On Document | |
| Nondorf Larry A | -- | None Listed On Document | |
| Nondorf Larry A | -- | None Listed On Document |
Source: Public Records
Tax History
| Year | Tax Paid | Tax Assessment Tax Assessment Total Assessment is a certain percentage of the fair market value that is determined by local assessors to be the total taxable value of land and additions on the property. | Land | Improvement |
|---|---|---|---|---|
| 2025 | -- | $54,505 | $3,980 | $50,525 |
| 2024 | -- | $59,775 | $9,250 | $50,525 |
| 2023 | $0 | $59,775 | $9,250 | $50,525 |
| 2022 | $0 | $46,385 | $1,270 | $45,115 |
| 2021 | $61 | $46,385 | $1,270 | $45,115 |
| 2020 | $61 | $46,385 | $1,270 | $45,115 |
| 2019 | $61 | $46,385 | $1,270 | $45,115 |
| 2018 | $155 | $46,385 | $1,270 | $45,115 |
| 2017 | $834 | $46,385 | $1,270 | $45,115 |
| 2016 | $243 | $32,455 | $1,270 | $31,185 |
| 2015 | $243 | $32,455 | $1,270 | $31,185 |
| 2014 | $243 | $32,455 | $1,270 | $31,185 |
| 2011 | -- | $32,455 | $1,270 | $31,185 |
Source: Public Records
Map
Nearby Homes
- 246 W 4th St
- 210 W 8th St
- 729 N Commercial Ave
- 747 N Commercial Ave
- 708 N Kansas St
- 824 N Commercial Ave
- 926 N Commercial Ave
- 648 E 2nd St
- 546 E 12th St
- 1007 E 3rd St
- 1436 N Commercial Ave
- 1029 Highland Dr
- East Superior Lots 7 8 9 Blk 28 St
- 598 Highway 14
- 2075 Birch Rd
- 22 Cabin Rd
- 123 County Rd
- County Rd
- 2453 180 Rd
- 140 Rd
Your Personal Tour Guide
Ask me questions while you tour the home.