353 Walnut St Brookline, MA 02445
Brookline Village NeighborhoodEstimated Value: $4,084,000 - $5,220,000
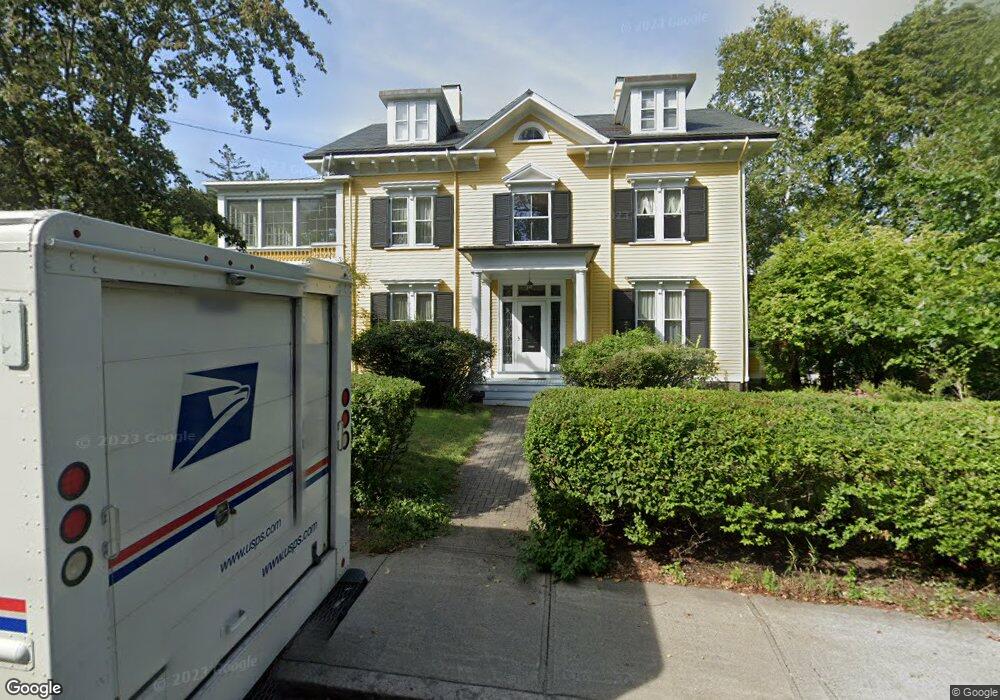
About This Home
This home is located at 353 Walnut St, Brookline, MA 02445 and is currently estimated at $4,606,536, approximately $797 per square foot. 353 Walnut St is a home located in Norfolk County with nearby schools including William H. Lincoln School, Brookline High School, and Maimonides School.
Ownership History
We collect this data history from publicly available records. To have your information removed, we recommend requesting removal directly through your county’s website.
Purchase Details
Home Values in the Area
Average Home Value in this Area
Purchase History
We collect this data history from publicly available records. To have your information removed, we recommend requesting removal directly through your county’s website.
| Date | Buyer | Sale Price | Title Company |
|---|---|---|---|
| $1,200,000 | -- |
Mortgage History
We collect this data history from publicly available records. To have your information removed, we recommend requesting removal directly through your county’s website.
| Date | Status | Borrower | Loan Amount |
|---|---|---|---|
| Open | $657,762 | ||
| Closed | $800,000 | ||
| Closed | $904,000 | ||
| Closed | $930,000 |
Tax History
We collect this data history from publicly available records. To have your information removed, we recommend requesting removal directly through your county’s website.
| Year | Tax Paid | Tax Assessment Tax Assessment Total Assessment is a certain percentage of the fair market value that is determined by local assessors to be the total taxable value of land and additions on the property. | Land | Improvement |
|---|---|---|---|---|
| 2025 | $41,707 | $4,225,600 | $1,578,300 | $2,647,300 |
| 2024 | $39,746 | $4,068,200 | $1,517,600 | $2,550,600 |
| 2023 | $36,989 | $3,710,000 | $1,264,800 | $2,445,200 |
| 2022 | $36,004 | $3,533,300 | $1,204,500 | $2,328,800 |
| 2021 | $33,295 | $3,397,400 | $1,158,200 | $2,239,200 |
| 2020 | $30,817 | $3,261,100 | $1,052,900 | $2,208,200 |
| 2019 | $29,101 | $3,105,800 | $1,002,800 | $2,103,000 |
| 2018 | $29,349 | $3,102,400 | $1,072,000 | $2,030,400 |
| 2017 | $28,917 | $2,926,800 | $1,011,300 | $1,915,500 |
| 2016 | $28,502 | $2,735,300 | $945,100 | $1,790,200 |
| 2015 | $27,302 | $2,556,400 | $883,300 | $1,673,100 |
| 2014 | $28,451 | $2,497,900 | $802,900 | $1,695,000 |
Map
- 428 Boylston St
- 16 Kennard Rd
- 108 Codman Rd
- 157 Cypress St Unit 2
- 1 Chestnut Place
- 50 Sumner Rd
- 22 Chestnut Place Unit 210
- 22 Chestnut Place Unit 306
- 68 Chestnut St Unit 2
- 101 Sumner Rd Unit 1
- 15 Catlin Rd
- 30 Cameron St Unit 7
- 258-260 Cypress St
- 114 Davis Ave Unit 2
- 50 Cameron St Unit 50
- 50 Franklin St
- 68 Dudley St
- 8 Leverett St Unit 4
- 293 Cypress St
- 185 Warren St
Ask me questions while you tour the home.