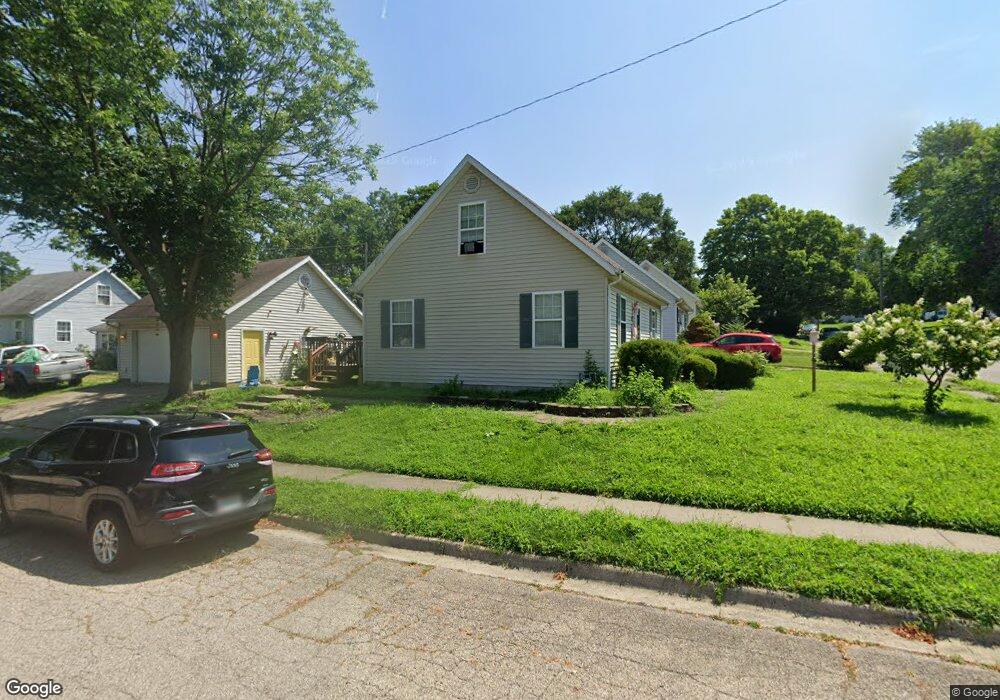
3539 Babson St Dayton, OH 45403
Wright View NeighborhoodEstimated Value: $124,000 - $165,000
4
Beds
2
Baths
1,165
Sq Ft
$124/Sq Ft
Est. Value
About This Home
This home is located at 3539 Babson St, Dayton, OH 45403 and is currently estimated at $144,407, approximately $123 per square foot. 3539 Babson St is a home located in Montgomery County with nearby schools including Ruskin Elementary School, Kiser Elementary, and Horizon Science Academy Dayton Downtown.
Ownership History
Date
Name
Owned For
Owner Type
Purchase Details
Closed on
Oct 13, 2020
Sold by
Rougier Emily A
Bought by
Murphy Surrie
Current Estimated Value
Home Financials for this Owner
Home Financials are based on the most recent Mortgage that was taken out on this home.
Original Mortgage
$93,587
Outstanding Balance
$82,516
Interest Rate
2.8%
Mortgage Type
FHA
Estimated Equity
$61,891
Purchase Details
Closed on
Aug 16, 2005
Sold by
Eiford Jeffrey A
Bought by
Rougier Emily A
Home Financials for this Owner
Home Financials are based on the most recent Mortgage that was taken out on this home.
Original Mortgage
$97,500
Interest Rate
5.69%
Mortgage Type
Fannie Mae Freddie Mac
Purchase Details
Closed on
Jul 19, 2000
Sold by
Eiford Mary E
Bought by
Eiford Jeffrey A
Purchase Details
Closed on
Jan 27, 1998
Sold by
Mcbride Philip E and Mcbride Eileen M
Bought by
Eiford Jeffrey A and Eiford Mary E
Home Financials for this Owner
Home Financials are based on the most recent Mortgage that was taken out on this home.
Original Mortgage
$69,750
Interest Rate
7.16%
Create a Home Valuation Report for This Property
The Home Valuation Report is an in-depth analysis detailing your home's value as well as a comparison with similar homes in the area
Home Values in the Area
Average Home Value in this Area
Purchase History
We collect this data history from publicly available records. To have your information removed, we recommend requesting removal directly through your county’s website.
| Date | Buyer | Sale Price | Title Company |
|---|---|---|---|
| Murphy Surrie | $95,400 | First Ohio Title Insurance | |
| Rougier Emily A | $97,500 | -- | |
| Eiford Jeffrey A | -- | -- | |
| Eiford Jeffrey A | $69,800 | Dayton Title Agency Inc | |
| Eiford Jeffrey A | $69,800 | -- |
Source: Public Records
Mortgage History
We collect this data history from publicly available records. To have your information removed, we recommend requesting removal directly through your county’s website.
| Date | Status | Borrower | Loan Amount |
|---|---|---|---|
| Open | Murphy Surrie | $93,587 | |
| Previous Owner | Rougier Emily A | $97,500 | |
| Previous Owner | Eiford Jeffrey A | $69,750 |
Source: Public Records
Tax History
| Year | Tax Paid | Tax Assessment Tax Assessment Total Assessment is a certain percentage of the fair market value that is determined by local assessors to be the total taxable value of land and additions on the property. | Land | Improvement |
|---|---|---|---|---|
| 2025 | $1,913 | $33,160 | $3,500 | $29,660 |
| 2024 | $1,863 | $33,160 | $3,500 | $29,660 |
| 2023 | $1,863 | $33,160 | $3,500 | $29,660 |
| 2022 | $1,930 | $26,570 | $2,800 | $23,770 |
| 2021 | $1,971 | $26,570 | $2,800 | $23,770 |
| 2020 | $1,914 | $26,570 | $2,800 | $23,770 |
| 2019 | $1,912 | $23,120 | $3,670 | $19,450 |
| 2018 | $1,915 | $23,120 | $3,670 | $19,450 |
| 2017 | $1,901 | $23,120 | $3,670 | $19,450 |
| 2016 | $2,110 | $24,490 | $3,990 | $20,500 |
| 2015 | $1,997 | $24,490 | $3,990 | $20,500 |
| 2014 | $1,997 | $24,490 | $3,990 | $20,500 |
| 2012 | -- | $31,570 | $5,640 | $25,930 |
Source: Public Records
Map
Nearby Homes
- 3405 E 5th St
- 263 S Hedges St
- 503 Sheridan Ave
- 161 S Harbine Ave
- 41 N Westview Ave
- 321 S Harbine Ave
- 3612 E 3rd St
- 1323 Huffman Ave
- 15 Drury St
- 44 S Harbine Ave
- 1401 Huffman Ave
- 1340 Huffman Ave
- 1312 Huffman Ave
- 24 More Ave
- 33 S Smithville Rd
- 3020 E 3rd St
- 4129 E 3rd St Unit 4127
- 116 Burkhardt Ave
- 59 Parnell Ave
- 133 Bircher Ave
Your Personal Tour Guide
Ask me questions while you tour the home.