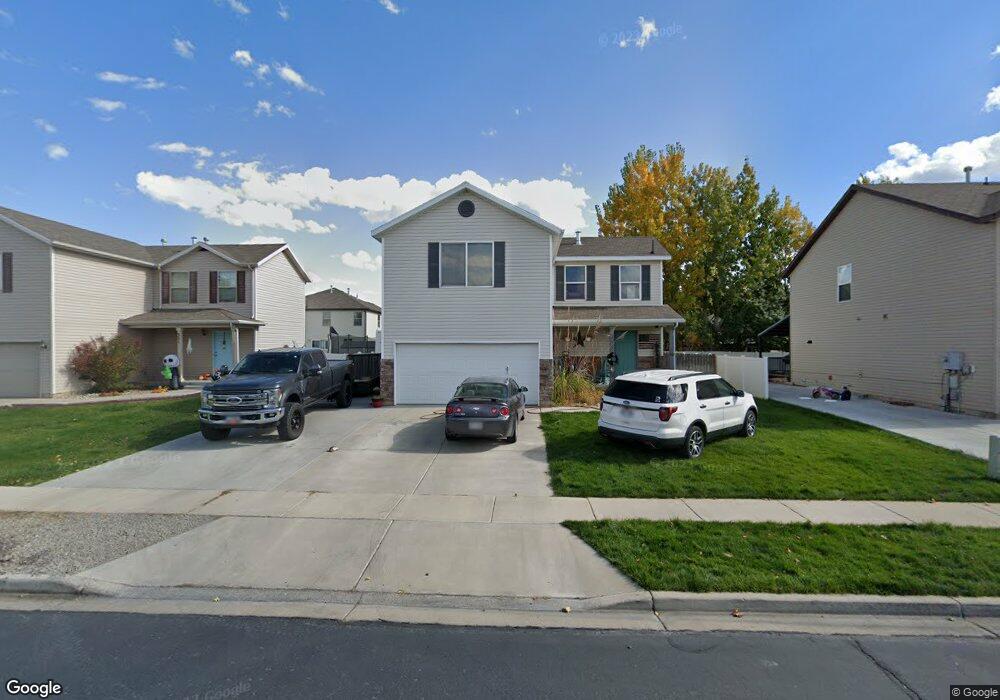
355 S 1280 W Spanish Fork, UT 84660
Estimated Value: $438,357 - $452,000
3
Beds
3
Baths
1,390
Sq Ft
$320/Sq Ft
Est. Value
About This Home
This home is located at 355 S 1280 W, Spanish Fork, UT 84660 and is currently estimated at $444,339, approximately $319 per square foot. 355 S 1280 W is a home located in Utah County with nearby schools including Riverview Elementary School, Spanish Fork Jr High School, and Spanish Fork High School.
Ownership History
Date
Name
Owned For
Owner Type
Purchase Details
Closed on
Mar 5, 2008
Sold by
Fieldstone Homes Utah Llc
Bought by
Bunker Tyson D and Bunker Nikki
Current Estimated Value
Home Financials for this Owner
Home Financials are based on the most recent Mortgage that was taken out on this home.
Original Mortgage
$195,290
Outstanding Balance
$119,493
Interest Rate
5.41%
Mortgage Type
FHA
Estimated Equity
$324,846
Create a Home Valuation Report for This Property
The Home Valuation Report is an in-depth analysis detailing your home's value as well as a comparison with similar homes in the area
Home Values in the Area
Average Home Value in this Area
Purchase History
We collect this data history from publicly available records. To have your information removed, we recommend requesting removal directly through your county’s website.
| Date | Buyer | Sale Price | Title Company |
|---|---|---|---|
| Bunker Tyson D | -- | Bartlett Title Insurance Ag |
Source: Public Records
Mortgage History
We collect this data history from publicly available records. To have your information removed, we recommend requesting removal directly through your county’s website.
| Date | Status | Borrower | Loan Amount |
|---|---|---|---|
| Open | Bunker Tyson D | $195,290 |
Source: Public Records
Tax History
| Year | Tax Paid | Tax Assessment Tax Assessment Total Assessment is a certain percentage of the fair market value that is determined by local assessors to be the total taxable value of land and additions on the property. | Land | Improvement |
|---|---|---|---|---|
| 2025 | $1,986 | $220,550 | -- | -- |
| 2024 | $1,986 | $204,710 | $0 | $0 |
| 2023 | $2,032 | $209,715 | $0 | $0 |
| 2022 | $2,156 | $218,240 | $0 | $0 |
| 2021 | $1,812 | $293,400 | $97,500 | $195,900 |
| 2020 | $1,726 | $271,700 | $88,600 | $183,100 |
| 2019 | $1,508 | $249,700 | $80,900 | $168,800 |
| 2018 | $1,401 | $224,200 | $74,400 | $149,800 |
| 2017 | $1,295 | $111,430 | $0 | $0 |
| 2016 | $1,220 | $103,565 | $0 | $0 |
| 2015 | $1,138 | $95,480 | $0 | $0 |
| 2014 | $1,045 | $88,000 | $0 | $0 |
Source: Public Records
Map
Nearby Homes
Your Personal Tour Guide
Ask me questions while you tour the home.