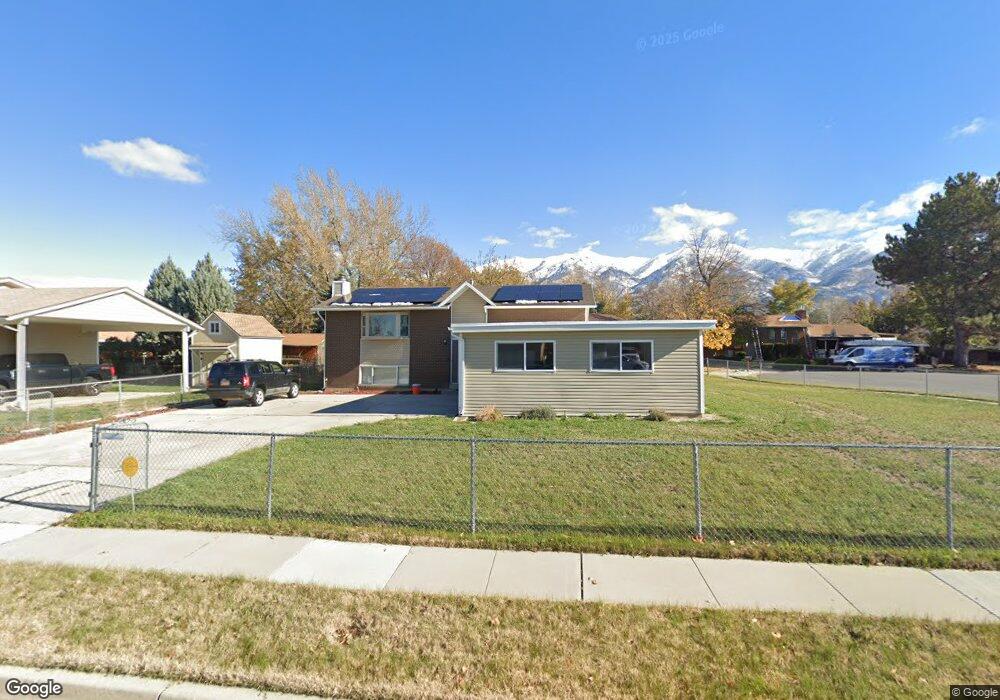
355 S 975 E Layton, UT 84041
Estimated Value: $431,000 - $459,204
About This Home
This home is located at 355 S 975 E, Layton, UT 84041 and is currently estimated at $446,551, approximately $221 per square foot. 355 S 975 E is a home located in Davis County with nearby schools including Creekside Elementary School, Fairfield Junior High School, and Davis High School.
Ownership History
We collect this data history from publicly available records. To have your information removed, we recommend requesting removal directly through your county’s website.
Purchase Details
Home Financials for this Owner
Home Financials are based on the most recent Mortgage that was taken out on this home.Purchase Details
Home Financials for this Owner
Home Financials are based on the most recent Mortgage that was taken out on this home.Purchase Details
Home Financials for this Owner
Home Financials are based on the most recent Mortgage that was taken out on this home.Purchase Details
Home Financials for this Owner
Home Financials are based on the most recent Mortgage that was taken out on this home.Purchase Details
Purchase Details
Purchase Details
Purchase Details
Home Financials for this Owner
Home Financials are based on the most recent Mortgage that was taken out on this home.Purchase Details
Home Financials for this Owner
Home Financials are based on the most recent Mortgage that was taken out on this home.Purchase Details
Home Financials for this Owner
Home Financials are based on the most recent Mortgage that was taken out on this home.Home Values in the Area
Average Home Value in this Area
Purchase History
We collect this data history from publicly available records. To have your information removed, we recommend requesting removal directly through your county’s website.
| Date | Buyer | Sale Price | Title Company |
|---|---|---|---|
| -- | Mountain View Title & | ||
| -- | Founders Title | ||
| -- | Inwest Title Services Inc | ||
| -- | Monument Title Agency | ||
| -- | United Title Svcs Of Utah | ||
| $135,271 | United Title Svcs Of Utah | ||
| -- | Bonneville Title Company Inc | ||
| -- | Bonneville Title Company Inc | ||
| -- | Bonneville Title Company Inc | ||
| -- | Bonneville Title Company Inc | ||
| -- | Avis & Archibald Title | ||
| -- | Avis & Archibald Title | ||
| -- | First American Title Co |
Mortgage History
We collect this data history from publicly available records. To have your information removed, we recommend requesting removal directly through your county’s website.
| Date | Status | Borrower | Loan Amount |
|---|---|---|---|
| Open | $237,840 | ||
| Closed | $217,683 | ||
| Previous Owner | $80,000 | ||
| Previous Owner | $90,000 | ||
| Previous Owner | $127,201 | ||
| Previous Owner | $128,306 | ||
| Previous Owner | $112,098 |
Tax History
We collect this data history from publicly available records. To have your information removed, we recommend requesting removal directly through your county’s website.
| Year | Tax Paid | Tax Assessment Tax Assessment Total Assessment is a certain percentage of the fair market value that is determined by local assessors to be the total taxable value of land and additions on the property. | Land | Improvement |
|---|---|---|---|---|
| 2025 | $2,033 | $213,400 | $114,459 | $98,941 |
| 2024 | $1,945 | $205,700 | $132,912 | $72,788 |
| 2023 | $1,921 | $358,000 | $153,856 | $204,144 |
| 2022 | $2,000 | $202,400 | $82,579 | $119,821 |
| 2021 | $1,795 | $271,000 | $119,169 | $151,831 |
| 2020 | $1,588 | $230,000 | $98,860 | $131,140 |
| 2019 | $1,565 | $222,000 | $92,625 | $129,375 |
| 2018 | $1,426 | $203,000 | $92,625 | $110,375 |
| 2016 | $1,245 | $91,465 | $30,502 | $60,963 |
| 2015 | $1,204 | $83,985 | $30,502 | $53,483 |
| 2014 | $1,156 | $82,437 | $30,502 | $51,935 |
| 2013 | -- | $84,744 | $20,680 | $64,064 |
Map
- 973 E 250 S
- 1302 E Amaryllis Way
- 1137 Holmes Creek Ln
- 298 W Mutton Hollow Rd
- 1052 E Mutton Hollow Rd
- 470 S Whitesides St
- 766 Rosewood Ln
- 897 E Elm St
- 811 E 200 S
- 866 N 325 W
- 711 S 825 E
- 1578 E Maple Way
- 254 S 1675 E
- 740 S Clearwater Ct
- 617 E 405 S
- 668 E Clearwater Dr
- 60 S Whitesides St
- 680 N Main St Trlr E-11
- 187 N Talbot Dr
- 209 N 850 E
Ask me questions while you tour the home.