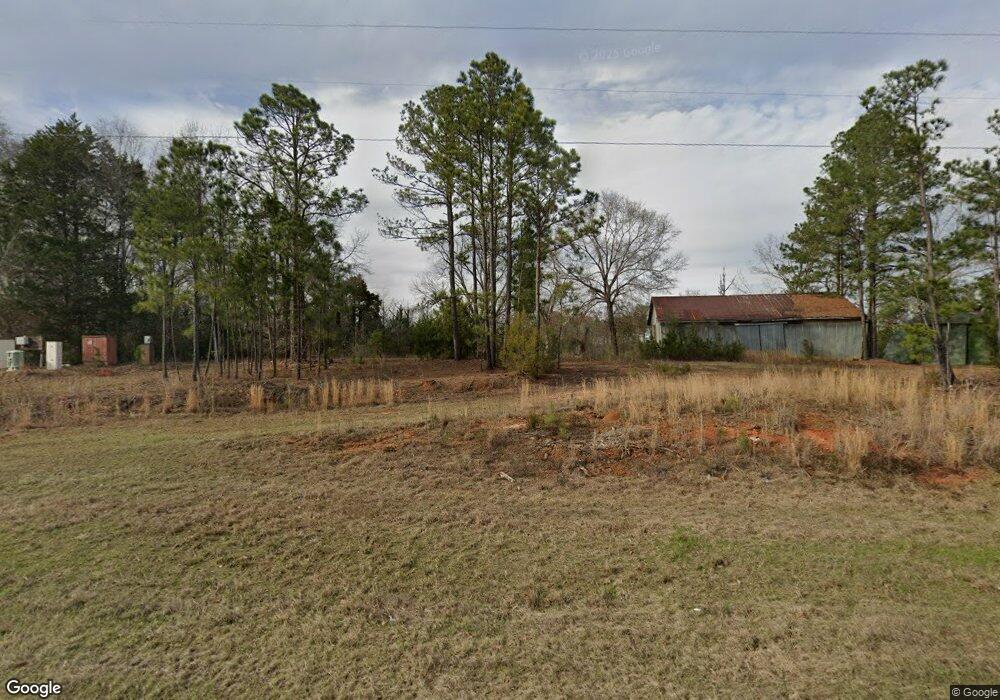
3559 Us Highway 82 Morris, GA 39867
Estimated Value: $136,000 - $251,000
3
Beds
1
Bath
2,112
Sq Ft
$91/Sq Ft
Est. Value
About This Home
This home is located at 3559 Us Highway 82, Morris, GA 39867 and is currently estimated at $192,158, approximately $90 per square foot. 3559 Us Highway 82 is a home with nearby schools including Quitman County Elementary School and Quitman County High School.
Ownership History
Date
Name
Owned For
Owner Type
Purchase Details
Closed on
Oct 30, 1973
Bought by
Sparks Sparks J and Sparks L
Current Estimated Value
Create a Home Valuation Report for This Property
The Home Valuation Report is an in-depth analysis detailing your home's value as well as a comparison with similar homes in the area
Purchase History
| Date | Buyer | Sale Price | Title Company |
|---|---|---|---|
| Sparks Sparks J | -- | -- |
Source: Public Records
Tax History
| Year | Tax Paid | Tax Assessment Tax Assessment Total Assessment is a certain percentage of the fair market value that is determined by local assessors to be the total taxable value of land and additions on the property. | Land | Improvement |
|---|---|---|---|---|
| 2025 | $1,959 | $52,498 | $6,400 | $46,098 |
| 2024 | $1,009 | $52,498 | $6,400 | $46,098 |
| 2023 | $1,018 | $52,498 | $6,400 | $46,098 |
| 2022 | $1,021 | $52,498 | $6,400 | $46,098 |
| 2021 | $656 | $36,457 | $7,253 | $29,204 |
| 2020 | $655 | $36,457 | $7,253 | $29,204 |
| 2019 | $656 | $36,457 | $7,253 | $29,204 |
| 2018 | $1,167 | $36,457 | $7,253 | $29,204 |
| 2017 | $586 | $37,348 | $7,253 | $30,095 |
| 2016 | $598 | $37,348 | $7,253 | $30,095 |
| 2015 | -- | $37,348 | $7,253 | $30,095 |
| 2014 | -- | $37,326 | $7,253 | $30,073 |
| 2013 | -- | $37,325 | $7,252 | $30,072 |
Source: Public Records
Map
Nearby Homes
- 3833
- 3833 US Highway 82
- 3912 US Highway 82
- 3912 US Hwy 82
- 0 Morris Station Unit TRACT A
- County Rd 11 Unit Coleman GA 39836
- County Rd 11 Unit Coleman GA 39836
- 683 Union Church Rd Unit LotWP001
- Old Fort Gaines Rd
- 854 Hatcher Rd
- 980 Thornton Rd
- XX2 Thornton Rd
- XX1 Thornton Rd
- Cotton Hill Rd
- 1298 Days Ave
- 0 Lots 2 3 4 Point Dr Unit 20065
- 220 Fair Rd
- 0 Days Ave
- 131 Pataula Shores Cir
- Old Spring Rd
Your Personal Tour Guide
Ask me questions while you tour the home.