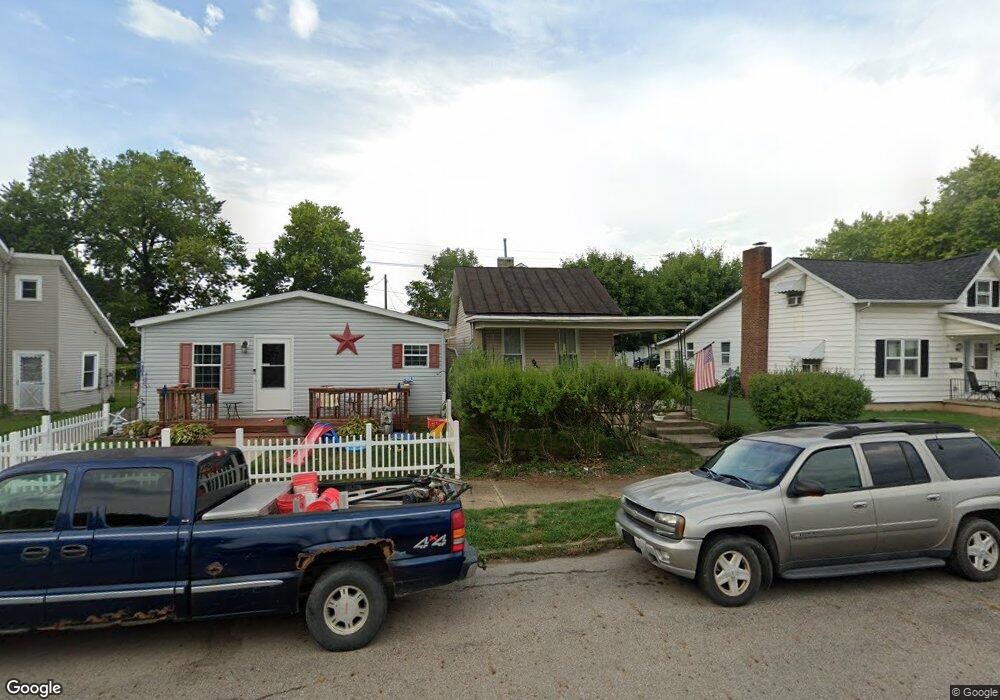
357 E Mound St Circleville, OH 43113
Circleville AreaEstimated Value: $195,000 - $232,000
About This Home
This home is located at 357 E Mound St, Circleville, OH 43113 and is currently estimated at $212,778, approximately $146 per square foot. 357 E Mound St is a home located in Pickaway County with nearby schools including Circleville High School, Crossroads Christian Academy, and New Hope Christian Academy.
Ownership History
We collect this data history from publicly available records. To have your information removed, we recommend requesting removal directly through your county’s website.
Purchase Details
Home Financials for this Owner
Home Financials are based on the most recent Mortgage that was taken out on this home.Purchase Details
Home Values in the Area
Average Home Value in this Area
Purchase History
We collect this data history from publicly available records. To have your information removed, we recommend requesting removal directly through your county’s website.
| Date | Buyer | Sale Price | Title Company |
|---|---|---|---|
| $124,000 | None Available | ||
| $28,000 | None Available |
Mortgage History
We collect this data history from publicly available records. To have your information removed, we recommend requesting removal directly through your county’s website.
| Date | Status | Borrower | Loan Amount |
|---|---|---|---|
| Open | $7,362 | ||
| Closed | $10,066 | ||
| Open | $122,637 | ||
| Previous Owner | $24,885 |
Tax History
We collect this data history from publicly available records. To have your information removed, we recommend requesting removal directly through your county’s website.
| Year | Tax Paid | Tax Assessment Tax Assessment Total Assessment is a certain percentage of the fair market value that is determined by local assessors to be the total taxable value of land and additions on the property. | Land | Improvement |
|---|---|---|---|---|
| 2025 | $3,839 | $50,680 | $5,680 | $45,000 |
| 2024 | $3,839 | $50,680 | $5,680 | $45,000 |
| 2023 | $1,777 | $50,680 | $5,680 | $45,000 |
| 2022 | $1,863 | $42,200 | $4,760 | $37,440 |
| 2021 | $1,874 | $42,200 | $4,760 | $37,440 |
| 2020 | $1,874 | $42,200 | $4,760 | $37,440 |
| 2019 | $661 | $18,170 | $4,760 | $13,410 |
| 2018 | $640 | $18,170 | $4,760 | $13,410 |
| 2017 | $456 | $18,170 | $4,760 | $13,410 |
| 2016 | $449 | $17,890 | $5,200 | $12,690 |
| 2015 | $450 | $17,890 | $5,200 | $12,690 |
| 2014 | $448 | $17,890 | $5,200 | $12,690 |
| 2013 | $518 | $19,160 | $5,200 | $13,960 |
Map
- 374 E Franklin St
- 414 E Mound St
- 412 S Washington St
- 311 E Main St
- 411 S Washington St
- 376 Watt St
- 484 E Main St
- 461 Watt St
- 471 Stella Ave
- 411 E Ohio St
- 603 S Court St
- 128 W Corwin St
- 123 W Corwin St
- 124 N Scioto St
- 110 Rustic Dr
- 231 Westwood Dr
- 485 N Pickaway St
- 232 Pontious Ln
- 1007 S Washington St
- 1031 S Washington St
- 350 E Mound St
- 342 E Mound St
- 338 E Mound St
- 354 E Mound St
- 336 E Mound St
- 341 E Mound St
- 358 E Mound St
- 353 E Mound St
- 360 E Mound St
- 345 E Mound St
- 335 E Mound St
- 359 E Mound St
- 328 E Mound St
- 326 E Mound St
- 364 E Mound St
- 345 E Franklin St
- 349 E Franklin St
- 325 E Mound St
- 351 E Franklin St
- 361 E Mound St
Ask me questions while you tour the home.