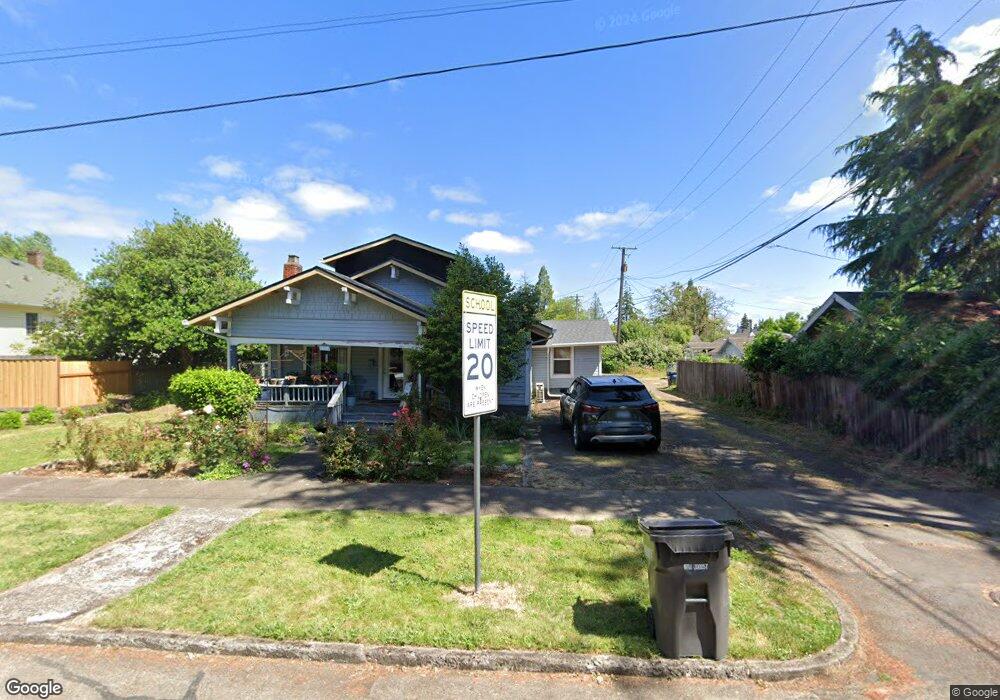
358 B St Independence, OR 97351
Estimated Value: $285,000 - $368,000
3
Beds
1
Bath
1,404
Sq Ft
$233/Sq Ft
Est. Value
About This Home
This home is located at 358 B St, Independence, OR 97351 and is currently estimated at $327,784, approximately $233 per square foot. 358 B St is a home located in Polk County with nearby schools including Independence Elementary School, Talmadge Middle School, and Central High School.
Ownership History
Date
Name
Owned For
Owner Type
Purchase Details
Closed on
Dec 29, 2025
Sold by
Brown Angela D and Snyder Desiree L
Bought by
Thompson Kirk D and Thompson Amanda K
Current Estimated Value
Home Financials for this Owner
Home Financials are based on the most recent Mortgage that was taken out on this home.
Original Mortgage
$125,000
Outstanding Balance
$123,200
Interest Rate
5.54%
Mortgage Type
New Conventional
Estimated Equity
$204,584
Purchase Details
Closed on
Sep 10, 2025
Sold by
May Floyd Dorothy
Bought by
Brown Angela D and Snyder Desiree L
Purchase Details
Closed on
Aug 5, 2009
Sold by
Reddell Glen Ray
Bought by
Floyd Dorothy M
Create a Home Valuation Report for This Property
The Home Valuation Report is an in-depth analysis detailing your home's value as well as a comparison with similar homes in the area
Home Values in the Area
Average Home Value in this Area
Purchase History
We collect this data history from publicly available records. To have your information removed, we recommend requesting removal directly through your county’s website.
| Date | Buyer | Sale Price | Title Company |
|---|---|---|---|
| Thompson Kirk D | -- | None Listed On Document | |
| Brown Angela D | -- | None Listed On Document | |
| Floyd Dorothy M | -- | Accommodation |
Source: Public Records
Mortgage History
We collect this data history from publicly available records. To have your information removed, we recommend requesting removal directly through your county’s website.
| Date | Status | Borrower | Loan Amount |
|---|---|---|---|
| Open | Thompson Kirk D | $125,000 |
Source: Public Records
Tax History
| Year | Tax Paid | Tax Assessment Tax Assessment Total Assessment is a certain percentage of the fair market value that is determined by local assessors to be the total taxable value of land and additions on the property. | Land | Improvement |
|---|---|---|---|---|
| 2026 | $2,062 | $116,340 | $58,720 | $57,620 |
| 2025 | $1,986 | $112,960 | $57,020 | $55,940 |
| 2024 | $1,986 | $109,670 | $55,360 | $54,310 |
| 2023 | $2,037 | $106,480 | $53,750 | $52,730 |
| 2022 | $1,870 | $103,380 | $52,180 | $51,200 |
| 2021 | $1,850 | $100,370 | $50,660 | $49,710 |
| 2020 | $1,801 | $97,450 | $49,190 | $48,260 |
| 2019 | $1,755 | $94,620 | $47,760 | $46,860 |
| 2018 | $1,699 | $91,870 | $46,370 | $45,500 |
| 2017 | $1,689 | $89,200 | $45,020 | $44,180 |
| 2016 | $1,721 | $86,610 | $43,700 | $42,910 |
| 2015 | $1,631 | $84,090 | $42,430 | $41,660 |
| 2014 | $1,601 | $81,650 | $41,200 | $40,450 |
Source: Public Records
Map
Nearby Homes
Your Personal Tour Guide
Ask me questions while you tour the home.