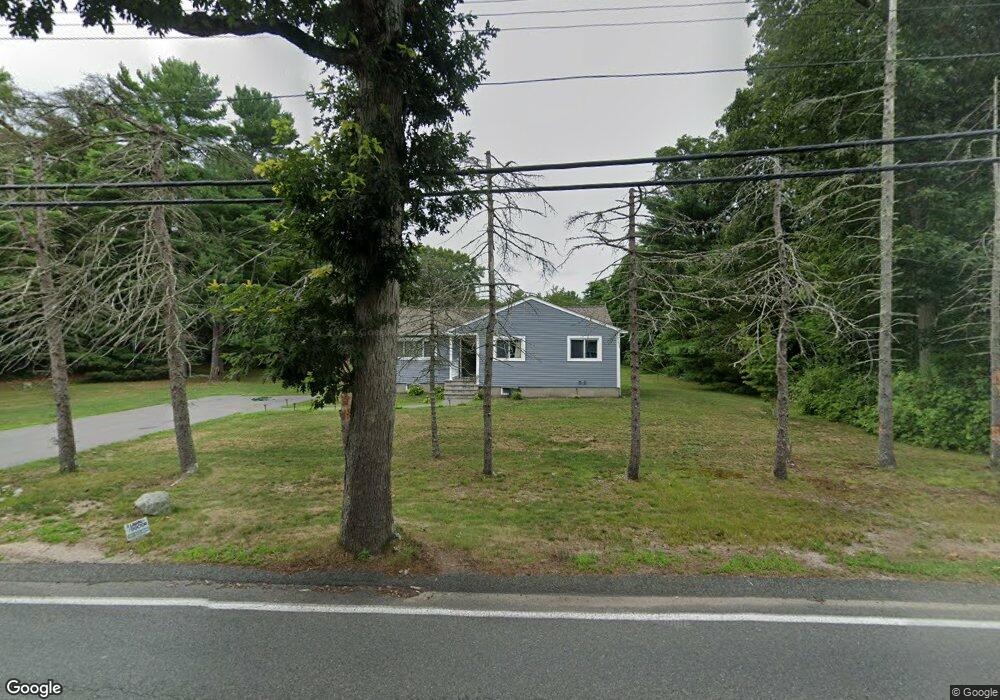
358 East St Sharon, MA 02067
Estimated Value: $672,607 - $718,000
About This Home
This home is located at 358 East St, Sharon, MA 02067 and is currently estimated at $687,402, approximately $591 per square foot. 358 East St is a home located in Norfolk County with nearby schools including East Elementary School, Sharon Middle School, and Sharon High School.
Ownership History
We collect this data history from publicly available records. To have your information removed, we recommend requesting removal directly through your county’s website.
Purchase Details
Purchase Details
Home Financials for this Owner
Home Financials are based on the most recent Mortgage that was taken out on this home.Home Values in the Area
Average Home Value in this Area
Purchase History
We collect this data history from publicly available records. To have your information removed, we recommend requesting removal directly through your county’s website.
| Date | Buyer | Sale Price | Title Company |
|---|---|---|---|
| -- | -- | ||
| $320,000 | -- |
Mortgage History
We collect this data history from publicly available records. To have your information removed, we recommend requesting removal directly through your county’s website.
| Date | Status | Borrower | Loan Amount |
|---|---|---|---|
| Previous Owner | $304,000 |
Tax History
We collect this data history from publicly available records. To have your information removed, we recommend requesting removal directly through your county’s website.
| Year | Tax Paid | Tax Assessment Tax Assessment Total Assessment is a certain percentage of the fair market value that is determined by local assessors to be the total taxable value of land and additions on the property. | Land | Improvement |
|---|---|---|---|---|
| 2025 | $10,561 | $604,200 | $422,700 | $181,500 |
| 2024 | $10,091 | $574,000 | $387,800 | $186,200 |
| 2023 | $9,879 | $531,400 | $362,600 | $168,800 |
| 2022 | $9,425 | $477,200 | $302,100 | $175,100 |
| 2021 | $9,302 | $455,300 | $284,900 | $170,400 |
| 2020 | $8,651 | $455,300 | $284,900 | $170,400 |
| 2019 | $8,014 | $412,900 | $252,000 | $160,900 |
| 2018 | $7,905 | $408,100 | $247,200 | $160,900 |
| 2017 | $7,693 | $392,100 | $231,200 | $160,900 |
| 2016 | $7,598 | $377,800 | $231,200 | $146,600 |
| 2015 | $7,010 | $345,300 | $212,000 | $133,300 |
| 2014 | $6,467 | $314,700 | $192,700 | $122,000 |
Map
- 15 Larason Farm Rd
- 99 Brook Rd
- 3 Bayberry Dr Unit 4
- 2161 Central St
- 2 Trowel Shop Pond Rd Unit 2
- 49 Ashcroft Rd
- 162 East St
- 4 Knife Shop Ln
- 2 Hillwood Ave
- 19 Country Ln
- 39 Christopher Dr Unit G
- 15 Pond View Cir
- 55 Brian Dr Unit D
- 37 Lantern Ln
- 30 Ashcroft Rd
- 84 Kim Terrace
- 53 Frances Dr
- 6 Jennifer Ln
- 36 Jessica Dr Unit H
- 47 Claire Dr
Ask me questions while you tour the home.