B
Seller's Agent in 2017
Bryan Gremillion
Better Choice Homes, LLC


Estimated Value: $494,841 - $547,000
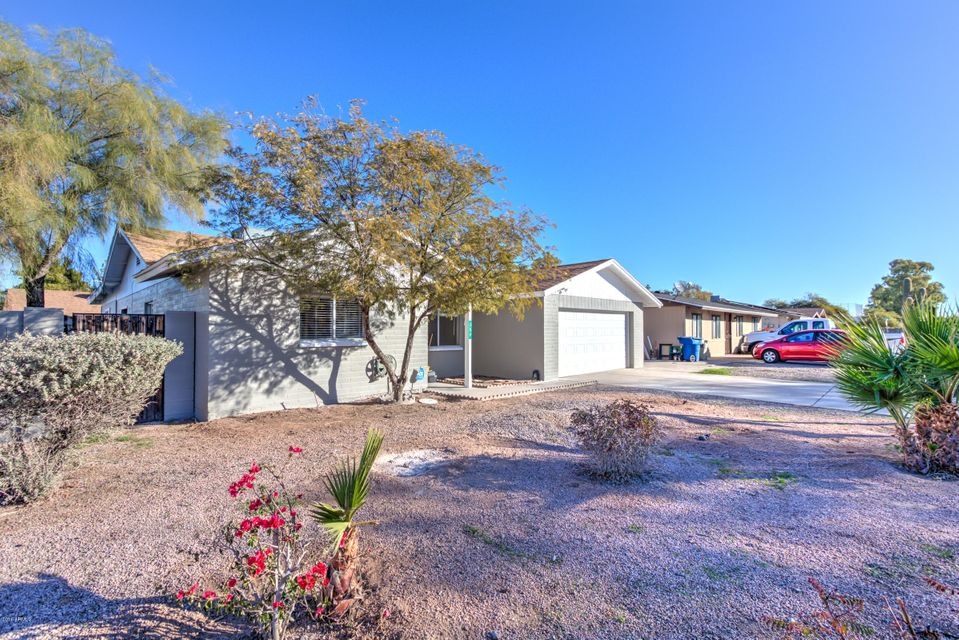
Beautiful remodel located next to downtown Gilbert and located in an amazing neighborhood with NO HOA! This house has everything you are looking for including an open floor plan which includes a formal living room as you walk through the front door, a gorgeous kitchen with all new white cabinetry and a large island with granite countertops. Right off the kitchen you will find a large eating nook and a massive family room so you can entertain guests. Split master floor plan with an elegantly remodeled master bathroom with a subway tile surround along with granite countertops. This 4 bedroom 2 bathroom home is ready for you to move in immediately!
Last Agent to Sell the Property
Bryan Gremillion
Better Choice Homes, LLC License #SA634605000 Listed on: 12/09/2016
We collect this data history from publicly available records. To have your information removed, we recommend requesting removal directly through your county’s website.
We collect this data history from publicly available records. To have your information removed, we recommend requesting removal directly through your county’s website.
| Date | Buyer | Sale Price | Title Company |
|---|---|---|---|
| -- | Security Title Agency Inc | ||
| $267,000 | Security Title Agency Inc | ||
| -- | Security Title Agency Inc | ||
| -- | Accommodation | ||
| $193,750 | Equity Title Agency | ||
| $148,900 | Chicago Title Insurance Co | ||
| $144,500 | Land Title Agency |
We collect this data history from publicly available records. To have your information removed, we recommend requesting removal directly through your county’s website.
| Date | Status | Borrower | Loan Amount |
|---|---|---|---|
| Open | $213,600 | ||
| Previous Owner | $141,455 | ||
| Previous Owner | $142,577 |
We collect this data history from publicly available records. To have your information removed, we recommend requesting removal directly through your county’s website.
| Date | Event | Price | List to Sale | Price per Sq Ft | Prior Sale |
|---|---|---|---|---|---|
| 09/30/2017 09/30/17 | Sold | $267,000 | -4.0% | $129 / Sq Ft | |
| 09/23/2017 09/23/17 | Pending | -- | -- | -- | |
| 09/09/2017 09/09/17 | Price Changed | $278,000 | +0.2% | $135 / Sq Ft | |
| 08/29/2017 08/29/17 | For Sale | $277,500 | 0.0% | $134 / Sq Ft | |
| 08/16/2017 08/16/17 | Pending | -- | -- | -- | |
| 08/13/2017 08/13/17 | Price Changed | $277,500 | -0.9% | $134 / Sq Ft | |
| 08/03/2017 08/03/17 | Price Changed | $279,900 | -0.9% | $136 / Sq Ft | |
| 07/28/2017 07/28/17 | Price Changed | $282,500 | -0.7% | $137 / Sq Ft | |
| 07/24/2017 07/24/17 | Price Changed | $284,500 | -0.1% | $138 / Sq Ft | |
| 07/17/2017 07/17/17 | For Sale | $284,900 | 0.0% | $138 / Sq Ft | |
| 07/06/2017 07/06/17 | Pending | -- | -- | -- | |
| 06/30/2017 06/30/17 | For Sale | $284,900 | 0.0% | $138 / Sq Ft | |
| 06/30/2017 06/30/17 | Price Changed | $284,900 | +6.7% | $138 / Sq Ft | |
| 06/21/2017 06/21/17 | Off Market | $267,000 | -- | -- | |
| 06/09/2017 06/09/17 | For Sale | $278,900 | 0.0% | $135 / Sq Ft | |
| 06/03/2017 06/03/17 | Pending | -- | -- | -- | |
| 05/26/2017 05/26/17 | Price Changed | $278,900 | -0.2% | $135 / Sq Ft | |
| 05/13/2017 05/13/17 | Price Changed | $279,500 | -0.1% | $135 / Sq Ft | |
| 04/25/2017 04/25/17 | Price Changed | $279,900 | -1.1% | $136 / Sq Ft | |
| 04/12/2017 04/12/17 | Price Changed | $283,000 | -0.4% | $137 / Sq Ft | |
| 04/03/2017 04/03/17 | Price Changed | $284,000 | -0.3% | $138 / Sq Ft | |
| 03/02/2017 03/02/17 | Price Changed | $284,900 | -1.0% | $138 / Sq Ft | |
| 02/24/2017 02/24/17 | For Sale | $287,900 | +7.8% | $139 / Sq Ft | |
| 02/21/2017 02/21/17 | Off Market | $267,000 | -- | -- | |
| 02/21/2017 02/21/17 | Price Changed | $287,900 | -0.6% | $139 / Sq Ft | |
| 02/16/2017 02/16/17 | Price Changed | $289,500 | -0.1% | $140 / Sq Ft | |
| 01/26/2017 01/26/17 | Price Changed | $289,900 | -1.7% | $140 / Sq Ft | |
| 01/04/2017 01/04/17 | Price Changed | $294,900 | 0.0% | $143 / Sq Ft | |
| 12/09/2016 12/09/16 | For Sale | $295,000 | +49.9% | $143 / Sq Ft | |
| 08/24/2016 08/24/16 | Sold | $196,750 | -1.1% | $95 / Sq Ft | View Prior Sale |
| 08/01/2016 08/01/16 | Pending | -- | -- | -- | |
| 07/08/2016 07/08/16 | For Sale | $199,000 | -- | $96 / Sq Ft |
We collect this data history from publicly available records. To have your information removed, we recommend requesting removal directly through your county’s website.
| Year | Tax Paid | Tax Assessment Tax Assessment Total Assessment is a certain percentage of the fair market value that is determined by local assessors to be the total taxable value of land and additions on the property. | Land | Improvement |
|---|---|---|---|---|
| 2025 | $1,531 | $16,857 | -- | -- |
| 2024 | $1,482 | $16,054 | -- | -- |
| 2023 | $1,482 | $36,350 | $7,270 | $29,080 |
| 2022 | $1,441 | $28,550 | $5,710 | $22,840 |
| 2021 | $1,490 | $27,030 | $5,400 | $21,630 |
| 2020 | $1,468 | $25,210 | $5,040 | $20,170 |
| 2019 | $1,364 | $22,580 | $4,510 | $18,070 |
| 2018 | $1,104 | $20,150 | $4,030 | $16,120 |
| 2017 | $1,283 | $17,860 | $3,570 | $14,290 |
| 2016 | $1,102 | $16,930 | $3,380 | $13,550 |
| 2015 | $1,004 | $14,660 | $2,930 | $11,730 |
B
Seller's Agent in 2017
Bryan Gremillion
Better Choice Homes, LLC

Buyer's Agent in 2017
Melanie Stern
The Virtual Realty Group
(602) 692-8566
1 in this area
18 Total Sales
Seller's Agent in 2016
DeAnn Hasquet
HomeSmart
(602) 390-3670
67 Total Sales
J
Seller Co-Listing Agent in 2016
James Riley
HomeSmart
(623) 322-1171
4 Total Sales
Buyer's Agent in 2016
Bradley Young
Better Choice Homes, LLC
(480) 420-9222
1 Total Sale
Source: Arizona Regional Multiple Listing Service (ARMLS)
MLS Number: 5534583
APN: 302-31-060
Disclaimer: Certain information contained herein is derived from information provided by parties other than Homes.com. All information provided is deemed reliable, but is not guaranteed to be accurate and should be independently verified.
![]() All information should be verified by the recipient and none is guaranteed as accurate by ARMLS
All information should be verified by the recipient and none is guaranteed as accurate by ARMLS
Listing Information presented by local MLS brokerage: Ten-X, local REALTOR®- Arlene Richardson - (888)-952-6393
Ask me questions while you tour the home.