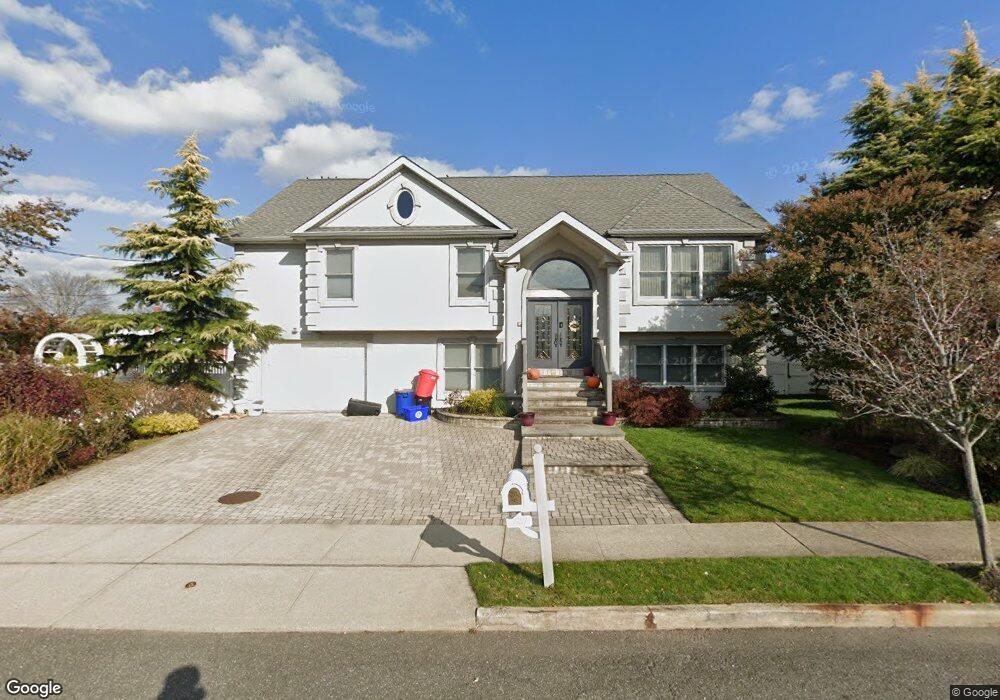
3581 Lorrie Dr Oceanside, NY 11572
Estimated Value: $1,032,036 - $1,276,000
Studio
3
Baths
1,730
Sq Ft
$667/Sq Ft
Est. Value
About This Home
This home is located at 3581 Lorrie Dr, Oceanside, NY 11572 and is currently estimated at $1,154,018, approximately $667 per square foot. 3581 Lorrie Dr is a home located in Nassau County with nearby schools including Boardman Elementary School, Oceanside Middle School, and Oceanside High School.
Ownership History
Date
Name
Owned For
Owner Type
Purchase Details
Closed on
Dec 22, 2022
Sold by
Feinberg Steven M and Feinberg Joann
Bought by
Feinberg Joann
Current Estimated Value
Purchase Details
Closed on
Dec 28, 2012
Sold by
Feinberg Steven
Bought by
Feinnberg Steven and Feinberg Joann
Purchase Details
Closed on
Dec 3, 2007
Sold by
Feinberg Steven M and Feinberg Rachel
Bought by
Feinberg Steven M
Purchase Details
Closed on
May 26, 2005
Sold by
Napoli Mario
Bought by
Feinberg Steven
Purchase Details
Closed on
Jan 4, 2001
Sold by
Rullan Joseph A and Rullan Neciy
Bought by
Napoli Mario and Napoli Leslie
Create a Home Valuation Report for This Property
The Home Valuation Report is an in-depth analysis detailing your home's value as well as a comparison with similar homes in the area
Home Values in the Area
Average Home Value in this Area
Purchase History
We collect this data history from publicly available records. To have your information removed, we recommend requesting removal directly through your county’s website.
| Date | Buyer | Sale Price | Title Company |
|---|---|---|---|
| Feinberg Joann | -- | Judicial Title | |
| Feinnberg Steven | -- | -- | |
| Feinberg Steven M | -- | Commonwealth Land Title | |
| Feinberg Steven | $754,000 | -- | |
| Napoli Mario | $440,000 | -- |
Source: Public Records
Tax History
| Year | Tax Paid | Tax Assessment Tax Assessment Total Assessment is a certain percentage of the fair market value that is determined by local assessors to be the total taxable value of land and additions on the property. | Land | Improvement |
|---|---|---|---|---|
| 2025 | $18,585 | $706 | $281 | $425 |
| 2024 | $5,735 | $717 | $285 | $432 |
| 2023 | $18,735 | $776 | $309 | $467 |
| 2022 | $18,735 | $750 | $298 | $452 |
| 2021 | $24,097 | $765 | $304 | $461 |
| 2020 | $19,020 | $1,138 | $906 | $232 |
| 2019 | $18,099 | $1,219 | $970 | $249 |
| 2018 | $18,356 | $1,608 | $0 | $0 |
| 2017 | $14,476 | $1,608 | $1,280 | $328 |
| 2016 | $21,835 | $1,608 | $1,280 | $328 |
| 2015 | $7,030 | $1,608 | $1,280 | $328 |
| 2014 | $7,030 | $1,608 | $1,280 | $328 |
| 2013 | $6,535 | $1,608 | $1,280 | $328 |
Source: Public Records
Map
Nearby Homes
- 3591 Annette Dr
- 3597 Annette Dr
- 266 Mott St
- 3603 Annette Dr
- 3586 Lorrie Dr
- 282 Mott St
- 3592 Annette Dr
- 3598 Annette Dr
- 3586 Annette Dr
- 3580 Annette Dr
- 3598 Lorrie Dr
- 284 Mott St
- 3604 Annette Dr
- 3609 Annette Dr
- 3604 Lorrie Dr
- 250 Mott St
- 3615 Mahlon Brower Dr
- 3591 Lorrie Dr
- 3615 Annette Dr
- 3605 Mahlon Brower Dr
Your Personal Tour Guide
Ask me questions while you tour the home.