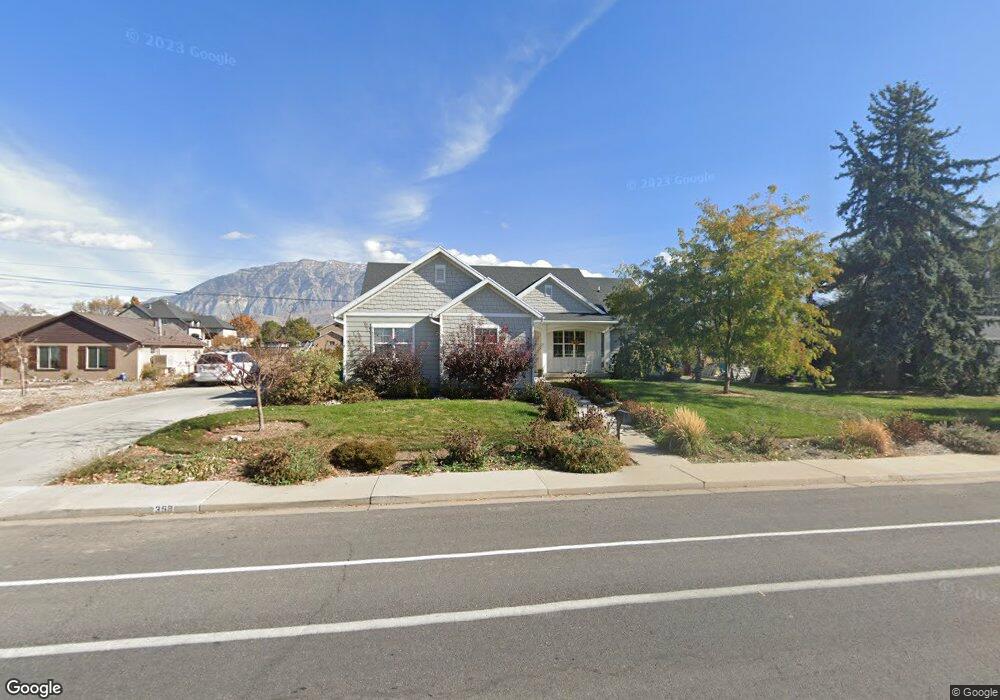
359 S 800 W Orem, UT 84058
Orem Park NeighborhoodEstimated Value: $578,000 - $640,014
3
Beds
2
Baths
1,743
Sq Ft
$350/Sq Ft
Est. Value
About This Home
This home is located at 359 S 800 W, Orem, UT 84058 and is currently estimated at $609,254, approximately $349 per square foot. 359 S 800 W is a home with nearby schools including Orem Elementary School, Orem Junior High School, and Mountain View High School.
Ownership History
Date
Name
Owned For
Owner Type
Purchase Details
Closed on
May 18, 2009
Sold by
Hansen Jack C and Hansen Koa Rae
Bought by
Hansen James M and Hansen Kerstin R
Current Estimated Value
Create a Home Valuation Report for This Property
The Home Valuation Report is an in-depth analysis detailing your home's value as well as a comparison with similar homes in the area
Home Values in the Area
Average Home Value in this Area
Purchase History
| Date | Buyer | Sale Price | Title Company |
|---|---|---|---|
| Hansen James M | -- | Horizon Title Insurance |
Source: Public Records
Tax History
| Year | Tax Paid | Tax Assessment Tax Assessment Total Assessment is a certain percentage of the fair market value that is determined by local assessors to be the total taxable value of land and additions on the property. | Land | Improvement |
|---|---|---|---|---|
| 2025 | $2,568 | $323,345 | -- | -- |
| 2024 | $2,568 | $313,995 | $0 | $0 |
| 2023 | $2,450 | $322,025 | $0 | $0 |
| 2022 | $2,394 | $304,755 | $0 | $0 |
| 2021 | $2,229 | $429,900 | $189,000 | $240,900 |
| 2020 | $2,044 | $387,400 | $151,200 | $236,200 |
| 2019 | $1,899 | $374,300 | $139,600 | $234,700 |
| 2018 | $1,845 | $347,400 | $120,200 | $227,200 |
| 2017 | $1,627 | $164,120 | $0 | $0 |
| 2016 | $1,742 | $162,085 | $0 | $0 |
| 2015 | $1,683 | $148,060 | $0 | $0 |
| 2014 | $1,566 | $137,115 | $0 | $0 |
Source: Public Records
Map
Nearby Homes
- 935 W 360 S
- 506 S 800 West St Unit 13
- 520 S 800 W Unit 14
- 237 S Ridgeview Dr
- 365 S 1015 W
- 570 S 800 West St Unit 15
- 896 W 30 S
- 1148 W 285 S
- 155 S 1200 W Unit 69
- 155 S 1200 W Unit 6
- 155 S 1200 W Unit 97
- 1041 W 600 S
- 216 S 400 W
- 278 S 1160 W
- 148 S 400 W
- 565 W 40 N
- 45 N 970 W
- 350 S 1200 W Unit 2
- 508 W 40 N
- 64 S 320 W
Your Personal Tour Guide
Ask me questions while you tour the home.