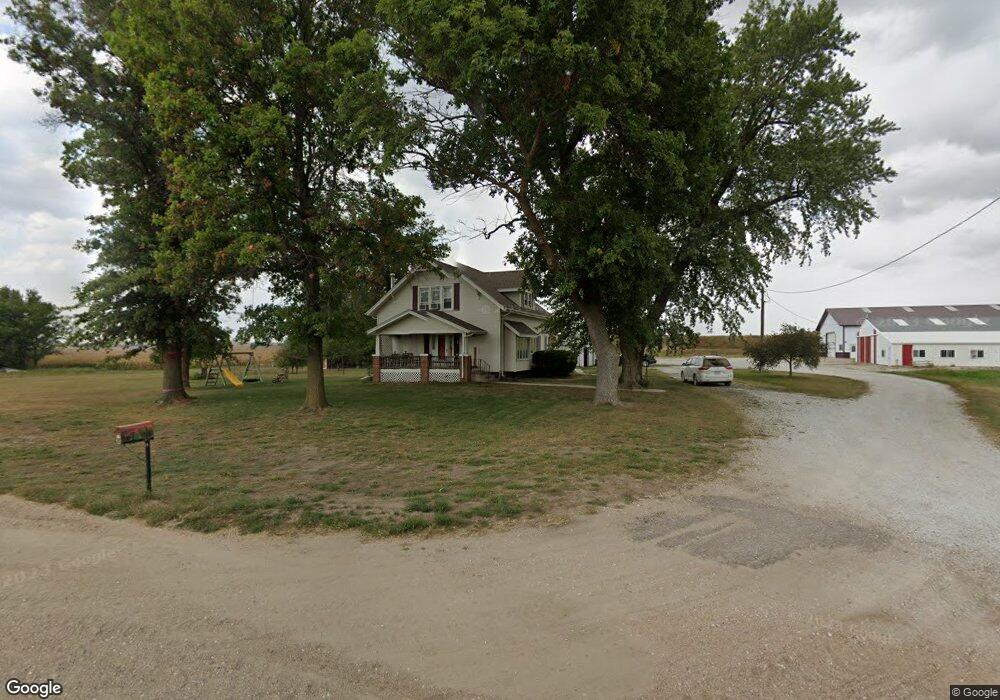
3590 Old Cheney Rd Beaver Crossing, NE 68313
Estimated Value: $220,000 - $542,000
3
Beds
3
Baths
1,611
Sq Ft
$240/Sq Ft
Est. Value
About This Home
This home is located at 3590 Old Cheney Rd, Beaver Crossing, NE 68313 and is currently estimated at $387,323, approximately $240 per square foot. 3590 Old Cheney Rd is a home located in Seward County with nearby schools including Milford Elementary School, Pleasant Dale Elementary School, and Milford Jr./Sr. High School.
Ownership History
Date
Name
Owned For
Owner Type
Purchase Details
Closed on
May 14, 2018
Sold by
Hostetler Roger and Hostetler Holly
Bought by
Hostetler Michael and Hostetler Krista
Current Estimated Value
Home Financials for this Owner
Home Financials are based on the most recent Mortgage that was taken out on this home.
Original Mortgage
$120,000
Outstanding Balance
$102,976
Interest Rate
4.44%
Mortgage Type
Future Advance Clause Open End Mortgage
Estimated Equity
$284,347
Create a Home Valuation Report for This Property
The Home Valuation Report is an in-depth analysis detailing your home's value as well as a comparison with similar homes in the area
Purchase History
| Date | Buyer | Sale Price | Title Company |
|---|---|---|---|
| Hostetler Michael | $120,000 | Title Services Of Blue Valle |
Source: Public Records
Mortgage History
| Date | Status | Borrower | Loan Amount |
|---|---|---|---|
| Open | Hostetler Michael | $120,000 |
Source: Public Records
Tax History
| Year | Tax Paid | Tax Assessment Tax Assessment Total Assessment is a certain percentage of the fair market value that is determined by local assessors to be the total taxable value of land and additions on the property. | Land | Improvement |
|---|---|---|---|---|
| 2025 | $3,044 | $380,138 | $65,295 | $314,843 |
| 2024 | $3,340 | $361,373 | $46,530 | $314,843 |
| 2023 | $4,708 | $361,373 | $46,530 | $314,843 |
| 2022 | $4,664 | $347,293 | $44,530 | $302,763 |
| 2021 | $4,458 | $347,293 | $44,530 | $302,763 |
| 2020 | $4,443 | $342,038 | $39,275 | $302,763 |
| 2019 | $4,344 | $342,038 | $39,275 | $302,763 |
| 2018 | $3,665 | $298,582 | $36,520 | $262,062 |
| 2017 | $3,562 | $191,021 | $32,450 | $158,571 |
| 2016 | $3,398 | $257,560 | $32,450 | $225,110 |
| 2015 | $3,410 | $257,560 | $32,450 | $225,110 |
| 2013 | $3,493 | $250,949 | $28,115 | $222,834 |
Source: Public Records
Map
Nearby Homes
Your Personal Tour Guide
Ask me questions while you tour the home.