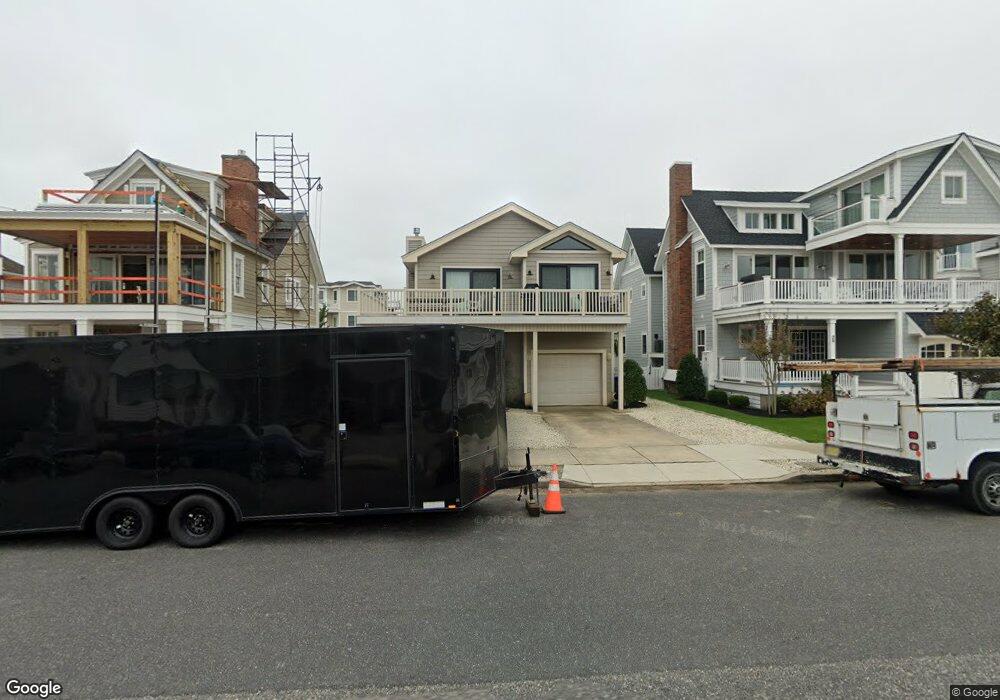
36 19th St E Avalon, NJ 08202
Estimated Value: $3,235,000 - $4,227,000
Studio
--
Bath
2,340
Sq Ft
$1,575/Sq Ft
Est. Value
About This Home
This home is located at 36 19th St E, Avalon, NJ 08202 and is currently estimated at $3,685,509, approximately $1,575 per square foot. 36 19th St E is a home located in Cape May County with nearby schools including Avalon Elementary School.
Ownership History
Date
Name
Owned For
Owner Type
Purchase Details
Closed on
Aug 19, 2011
Sold by
Siranides Elaine and Luciani Louis J
Bought by
Norman Stephen C and Whitby Norman Debra
Current Estimated Value
Home Financials for this Owner
Home Financials are based on the most recent Mortgage that was taken out on this home.
Original Mortgage
$76,250
Outstanding Balance
$62,242
Interest Rate
4.2%
Mortgage Type
Credit Line Revolving
Estimated Equity
$3,623,267
Create a Home Valuation Report for This Property
The Home Valuation Report is an in-depth analysis detailing your home's value as well as a comparison with similar homes in the area
Home Values in the Area
Average Home Value in this Area
Purchase History
| Date | Buyer | Sale Price | Title Company |
|---|---|---|---|
| Norman Stephen C | $1,575,000 | None Available |
Source: Public Records
Mortgage History
| Date | Status | Borrower | Loan Amount |
|---|---|---|---|
| Open | Norman Stephen C | $76,250 | |
| Previous Owner | Norman Stephen C | $1,067,500 |
Source: Public Records
Tax History
| Year | Tax Paid | Tax Assessment Tax Assessment Total Assessment is a certain percentage of the fair market value that is determined by local assessors to be the total taxable value of land and additions on the property. | Land | Improvement |
|---|---|---|---|---|
| 2025 | $12,434 | $2,025,000 | $1,700,000 | $325,000 |
| 2024 | $12,434 | $2,025,000 | $1,700,000 | $325,000 |
| 2023 | $12,332 | $2,025,000 | $1,700,000 | $325,000 |
| 2022 | $11,502 | $2,025,000 | $1,700,000 | $325,000 |
| 2021 | $11,077 | $2,025,000 | $1,700,000 | $325,000 |
| 2020 | $10,652 | $2,025,000 | $1,700,000 | $325,000 |
| 2019 | $10,328 | $2,025,000 | $1,700,000 | $325,000 |
| 2018 | $9,882 | $2,025,000 | $1,700,000 | $325,000 |
| 2017 | $9,501 | $1,708,800 | $1,400,000 | $308,800 |
| 2016 | $9,398 | $1,708,800 | $1,400,000 | $308,800 |
| 2015 | $9,245 | $1,708,800 | $1,400,000 | $308,800 |
| 2014 | $9,142 | $1,708,800 | $1,400,000 | $308,800 |
Source: Public Records
Map
Nearby Homes
Your Personal Tour Guide
Ask me questions while you tour the home.