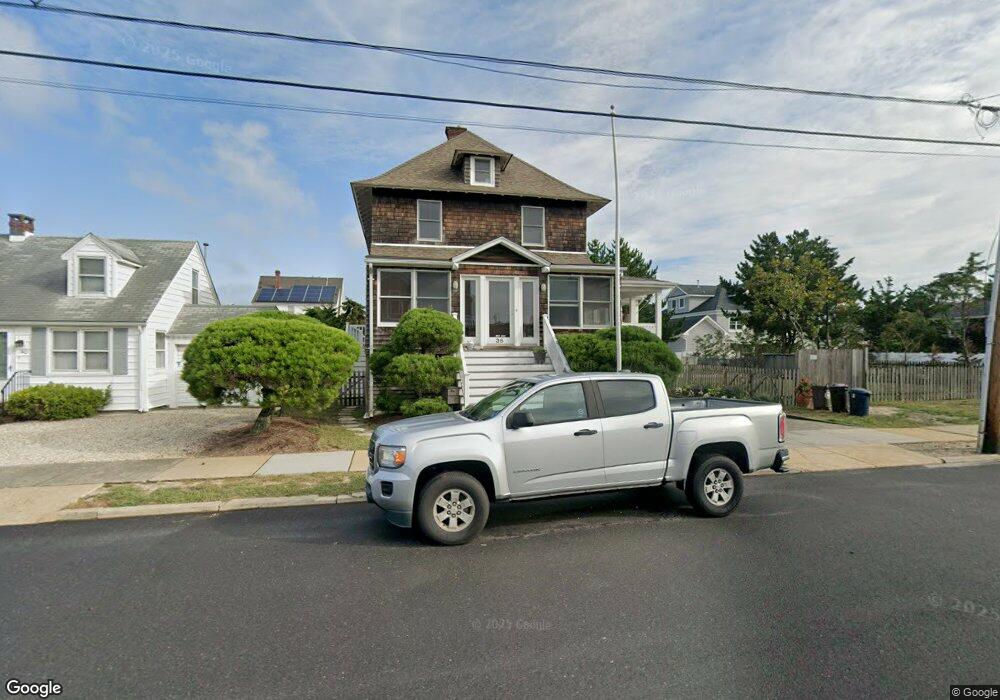
36 8th Ave Seaside Park, NJ 08752
Estimated Value: $1,823,982 - $2,920,000
5
Beds
4
Baths
4,408
Sq Ft
$519/Sq Ft
Est. Value
About This Home
This home is located at 36 8th Ave, Seaside Park, NJ 08752 and is currently estimated at $2,289,496, approximately $519 per square foot. 36 8th Ave is a home located in Ocean County with nearby schools including Central Regional Middle School and Central Regional High School.
Ownership History
Date
Name
Owned For
Owner Type
Purchase Details
Closed on
Dec 10, 2009
Sold by
Neal Ronald R and Neal Janet
Bought by
Neal Ronald R and Neal Janet
Current Estimated Value
Purchase Details
Closed on
Aug 15, 2000
Create a Home Valuation Report for This Property
The Home Valuation Report is an in-depth analysis detailing your home's value as well as a comparison with similar homes in the area
Home Values in the Area
Average Home Value in this Area
Purchase History
| Date | Buyer | Sale Price | Title Company |
|---|---|---|---|
| Neal Ronald R | -- | None Available | |
| -- | -- | -- |
Source: Public Records
Tax History
| Year | Tax Paid | Tax Assessment Tax Assessment Total Assessment is a certain percentage of the fair market value that is determined by local assessors to be the total taxable value of land and additions on the property. | Land | Improvement |
|---|---|---|---|---|
| 2025 | $16,734 | $964,500 | $650,000 | $314,500 |
| 2024 | $15,519 | $964,500 | $650,000 | $314,500 |
| 2023 | $14,969 | $964,500 | $650,000 | $314,500 |
| 2022 | $14,969 | $964,500 | $650,000 | $314,500 |
| 2021 | $14,651 | $964,500 | $650,000 | $314,500 |
| 2020 | $14,496 | $964,500 | $650,000 | $314,500 |
| 2019 | $14,342 | $964,500 | $650,000 | $314,500 |
| 2018 | $13,407 | $964,500 | $650,000 | $314,500 |
| 2017 | $13,609 | $964,500 | $650,000 | $314,500 |
| 2016 | $12,337 | $940,300 | $700,000 | $240,300 |
| 2015 | $12,873 | $940,300 | $700,000 | $240,300 |
| 2014 | $12,299 | $940,300 | $700,000 | $240,300 |
Source: Public Records
Map
Nearby Homes
Your Personal Tour Guide
Ask me questions while you tour the home.