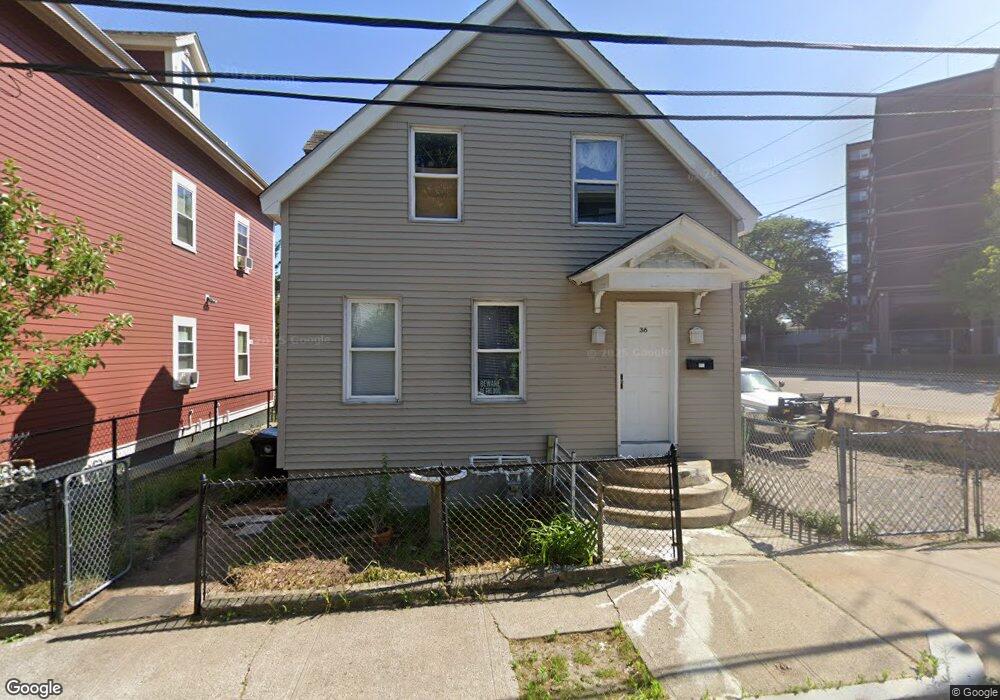
36 Barton St Pawtucket, RI 02860
Downtown Pawtucket NeighborhoodEstimated Value: $289,000 - $417,000
2
Beds
2
Baths
660
Sq Ft
$528/Sq Ft
Est. Value
About This Home
This home is located at 36 Barton St, Pawtucket, RI 02860 and is currently estimated at $348,450, approximately $527 per square foot. 36 Barton St is a home located in Providence County with nearby schools including International Charter School and Saint Raphael Academy.
Ownership History
Date
Name
Owned For
Owner Type
Purchase Details
Closed on
Oct 16, 2002
Sold by
Obrien Edward J
Bought by
Batres Mario and Deleon Sylvia P
Current Estimated Value
Home Financials for this Owner
Home Financials are based on the most recent Mortgage that was taken out on this home.
Original Mortgage
$68,000
Interest Rate
6.18%
Create a Home Valuation Report for This Property
The Home Valuation Report is an in-depth analysis detailing your home's value as well as a comparison with similar homes in the area
Home Values in the Area
Average Home Value in this Area
Purchase History
We collect this data history from publicly available records. To have your information removed, we recommend requesting removal directly through your county’s website.
| Date | Buyer | Sale Price | Title Company |
|---|---|---|---|
| Batres Mario | $85,000 | -- |
Source: Public Records
Mortgage History
We collect this data history from publicly available records. To have your information removed, we recommend requesting removal directly through your county’s website.
| Date | Status | Borrower | Loan Amount |
|---|---|---|---|
| Open | Batres Mario | $122,409 | |
| Closed | Batres Mario | $68,000 |
Source: Public Records
Tax History
| Year | Tax Paid | Tax Assessment Tax Assessment Total Assessment is a certain percentage of the fair market value that is determined by local assessors to be the total taxable value of land and additions on the property. | Land | Improvement |
|---|---|---|---|---|
| 2025 | $2,929 | $222,700 | $77,700 | $145,000 |
| 2024 | $2,748 | $222,700 | $77,700 | $145,000 |
| 2023 | $2,595 | $153,200 | $33,900 | $119,300 |
| 2022 | $2,540 | $153,200 | $33,900 | $119,300 |
| 2021 | $2,540 | $153,200 | $33,900 | $119,300 |
| 2020 | $2,628 | $125,800 | $42,400 | $83,400 |
| 2019 | $2,628 | $125,800 | $42,400 | $83,400 |
| 2018 | $2,532 | $125,800 | $42,400 | $83,400 |
| 2017 | $2,222 | $97,800 | $38,500 | $59,300 |
| 2016 | $2,141 | $97,800 | $38,500 | $59,300 |
| 2015 | $2,141 | $97,800 | $38,500 | $59,300 |
| 2014 | $2,050 | $88,900 | $38,500 | $50,400 |
Source: Public Records
Map
Nearby Homes
- 256 High St
- 88 Barton St
- 112 Clay St
- 140 Dexter St
- 511 High St
- 517 High St
- 300 Front St Unit 105
- 28 Bayley St Unit 301
- 28 Bayley St Unit 107
- 28 Bayley St Unit 406
- 35 Rand St
- 36 Underwood St
- 30 Foundry St Unit 5
- 2 King St
- 35 Allen Ave
- 153 Central Ave
- 38 Lawrence St
- 29 Woodbine St Unit 11
- 128 Summer St Unit 130
- 50 Garfield St
- 32 Barton St
- 123 Montgomery St
- 37-63 Barton St
- 27 Miller St
- 141 Montgomery St
- 17 Miller St
- 29 Barton St
- 21 Miller St
- 109 Montgomery St
- 278 High St Unit 1
- 278 High St Unit 5
- 278 High St Unit 2
- 278 High St Unit 4
- 278 High St Unit 3
- 52 Jackson St Unit 1
- 159 Montgomery St
- 46 Jackson St
- 42 Jackson St
- 232 High St
- 161 Montgomery St Unit 8
Your Personal Tour Guide
Ask me questions while you tour the home.