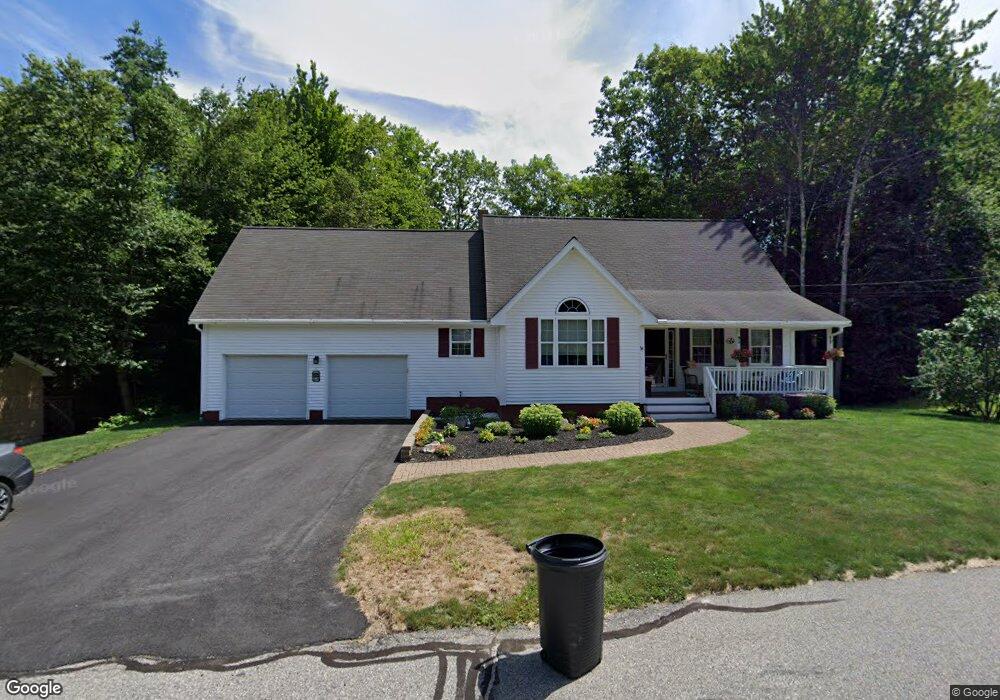
36 Belaire Dr Springvale, ME 04083
Estimated Value: $394,000 - $498,000
3
Beds
3
Baths
1,694
Sq Ft
$259/Sq Ft
Est. Value
About This Home
This home is located at 36 Belaire Dr, Springvale, ME 04083 and is currently estimated at $438,412, approximately $258 per square foot. 36 Belaire Dr is a home located in York County with nearby schools including St Thomas Consolidated School and Sanford Christian Academy.
Ownership History
Date
Name
Owned For
Owner Type
Purchase Details
Closed on
Jul 15, 2020
Sold by
Carpenter Nancy J Est
Bought by
Eldridge Donna and Eldridge David M
Current Estimated Value
Purchase Details
Closed on
Aug 7, 2008
Sold by
Carpenter David L
Bought by
Carpenter Nancy J
Create a Home Valuation Report for This Property
The Home Valuation Report is an in-depth analysis detailing your home's value as well as a comparison with similar homes in the area
Home Values in the Area
Average Home Value in this Area
Purchase History
| Date | Buyer | Sale Price | Title Company |
|---|---|---|---|
| Eldridge Donna | -- | None Available | |
| Carpenter Nancy J | -- | -- |
Source: Public Records
Tax History
| Year | Tax Paid | Tax Assessment Tax Assessment Total Assessment is a certain percentage of the fair market value that is determined by local assessors to be the total taxable value of land and additions on the property. | Land | Improvement |
|---|---|---|---|---|
| 2025 | $6,154 | $359,900 | $48,400 | $311,500 |
| 2024 | $5,809 | $359,900 | $48,400 | $311,500 |
| 2023 | $5,405 | $357,000 | $48,400 | $308,600 |
| 2022 | $5,284 | $357,000 | $48,400 | $308,600 |
| 2021 | $5,225 | $287,400 | $48,400 | $239,000 |
| 2020 | $3,976 | $197,200 | $48,400 | $148,800 |
| 2019 | $3,817 | $184,400 | $48,400 | $136,000 |
| 2018 | $3,341 | $178,900 | $48,400 | $130,500 |
| 2017 | $3,532 | $170,300 | $48,400 | $121,900 |
| 2016 | $3,677 | $161,700 | $48,500 | $113,200 |
| 2015 | $3,341 | $167,600 | $50,200 | $117,400 |
| 2014 | $3,338 | $167,600 | $50,200 | $117,400 |
| 2013 | -- | $170,400 | $50,200 | $120,200 |
Source: Public Records
Map
Nearby Homes
Your Personal Tour Guide
Ask me questions while you tour the home.