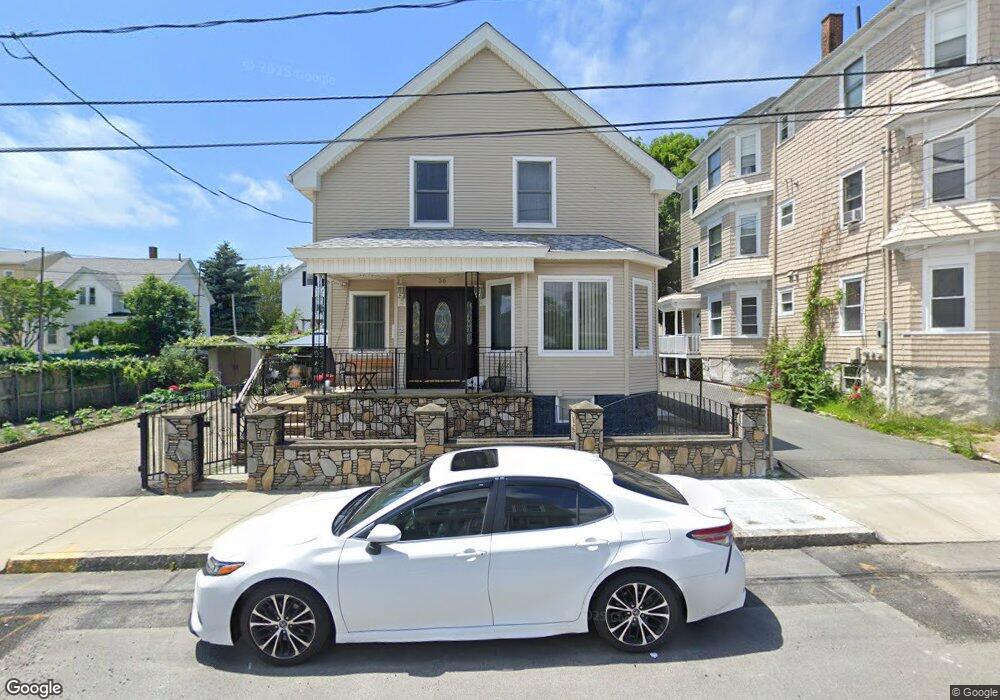
36 Beverly St Fall River, MA 02720
Bank Street NeighborhoodEstimated Value: $356,000 - $411,000
About This Home
This home is located at 36 Beverly St, Fall River, MA 02720 and is currently estimated at $376,298, approximately $279 per square foot. 36 Beverly St is a home located in Bristol County with nearby schools including Mary Fonseca Elementary School, Morton Middle School, and B M C Durfee High School.
Ownership History
We collect this data history from publicly available records. To have your information removed, we recommend requesting removal directly through your county’s website.
Purchase Details
Home Values in the Area
Average Home Value in this Area
Purchase History
We collect this data history from publicly available records. To have your information removed, we recommend requesting removal directly through your county’s website.
| Date | Buyer | Sale Price | Title Company |
|---|---|---|---|
| $105,000 | -- |
Mortgage History
We collect this data history from publicly available records. To have your information removed, we recommend requesting removal directly through your county’s website.
| Date | Status | Borrower | Loan Amount |
|---|---|---|---|
| Open | $100,000 | ||
| Closed | $50,000 | ||
| Closed | $92,000 |
Tax History
We collect this data history from publicly available records. To have your information removed, we recommend requesting removal directly through your county’s website.
| Year | Tax Paid | Tax Assessment Tax Assessment Total Assessment is a certain percentage of the fair market value that is determined by local assessors to be the total taxable value of land and additions on the property. | Land | Improvement |
|---|---|---|---|---|
| 2025 | $3,391 | $296,200 | $113,800 | $182,400 |
| 2024 | $3,217 | $280,000 | $111,500 | $168,500 |
| 2023 | $3,042 | $247,900 | $100,500 | $147,400 |
| 2022 | $2,837 | $224,800 | $94,800 | $130,000 |
| 2021 | $2,603 | $188,200 | $90,600 | $97,600 |
| 2020 | $2,598 | $179,800 | $86,400 | $93,400 |
| 2019 | $2,603 | $178,500 | $90,400 | $88,100 |
| 2018 | $2,433 | $166,400 | $91,000 | $75,400 |
| 2017 | $2,318 | $165,600 | $91,000 | $74,600 |
| 2016 | $2,239 | $164,300 | $93,800 | $70,500 |
| 2015 | $2,149 | $164,300 | $93,800 | $70,500 |
| 2014 | $2,067 | $164,300 | $93,800 | $70,500 |
Map
- 956 Maple St
- 37 Shawmut St
- 615 Robeson St
- 618 Robeson St
- 1017 Pine St
- 119-121 Tremont St
- 51 Summerfield St
- 47 Summerfield St
- 434 Linden St Unit 2
- 434 Linden St Unit 4
- 609 Cherry St
- 30 Orange St
- 540 Cherry St Unit 1
- 533 Locust St Unit 4
- 533 Locust St Unit 8
- 45 Read St
- 501 Pine St
- 464 Bank St Unit 10
- 65-67 Farnham St
- 89 Oak St
- 915 Walnut St
- 915 Walnut St Unit 2
- 915 Walnut St Unit 3
- 45 Home St
- 929 Walnut St
- 52 Home St
- 33 Home St
- 33 Home St Unit 2
- 73 Home St Unit 3
- 73 Home St Unit 4
- 73 Home St Unit 1
- 73 Home St
- 945 Walnut St
- 926 Walnut St
- 46 Beverly St
- 46 Beverly St Unit 2
- 46 Beverly St Unit 1
- 46 Beverly St Unit 3
- 25 Home St
- 883 Walnut St
Ask me questions while you tour the home.