36 Cornhill St Bridgeport, CT 06606
North End NeighborhoodEstimated Value: $409,000 - $419,000
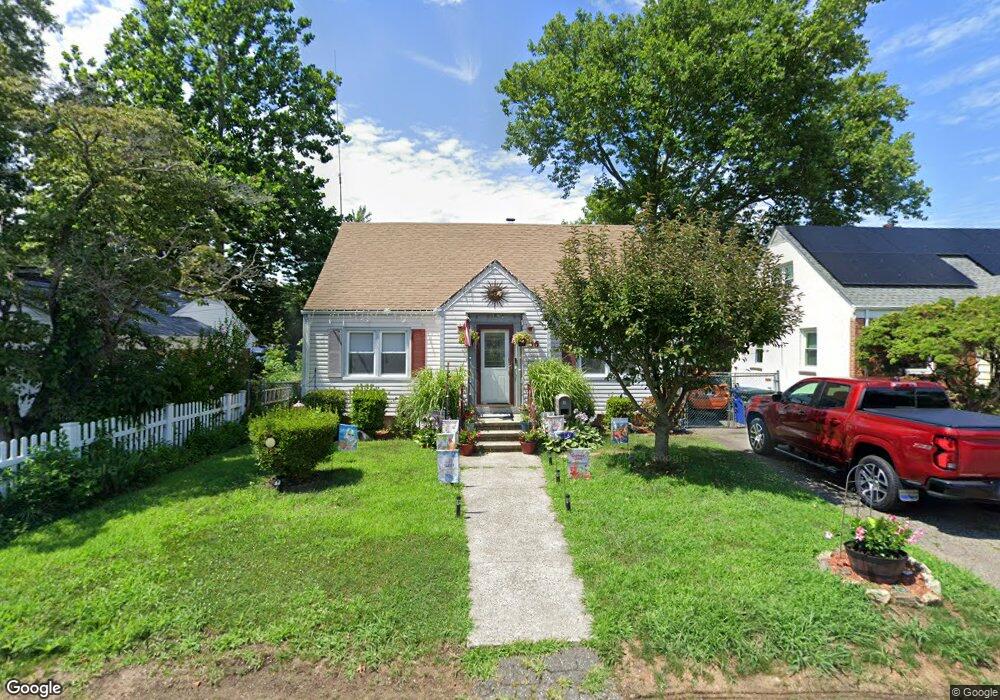
About This Home
This home is located at 36 Cornhill St, Bridgeport, CT 06606 and is currently estimated at $414,857, approximately $313 per square foot. 36 Cornhill St is a home located in Fairfield County with nearby schools including Blackham School, Central High School, and St Andrew School.
Ownership History
We collect this data history from publicly available records. To have your information removed, we recommend requesting removal directly through your county’s website.
Purchase Details
Home Values in the Area
Average Home Value in this Area
Purchase History
We collect this data history from publicly available records. To have your information removed, we recommend requesting removal directly through your county’s website.
| Date | Buyer | Sale Price | Title Company |
|---|---|---|---|
| $100,000 | -- |
Tax History
We collect this data history from publicly available records. To have your information removed, we recommend requesting removal directly through your county’s website.
| Year | Tax Paid | Tax Assessment Tax Assessment Total Assessment is a certain percentage of the fair market value that is determined by local assessors to be the total taxable value of land and additions on the property. | Land | Improvement |
|---|---|---|---|---|
| 2025 | $7,081 | $162,970 | $75,310 | $87,660 |
| 2024 | $7,081 | $162,970 | $75,310 | $87,660 |
| 2023 | $7,081 | $162,970 | $75,310 | $87,660 |
| 2022 | $7,081 | $162,970 | $75,310 | $87,660 |
| 2021 | $7,081 | $162,970 | $75,310 | $87,660 |
| 2020 | $5,862 | $108,580 | $39,340 | $69,240 |
| 2019 | $5,862 | $108,580 | $39,340 | $69,240 |
| 2018 | $5,903 | $108,580 | $39,340 | $69,240 |
| 2017 | $5,903 | $108,580 | $39,340 | $69,240 |
| 2016 | $5,903 | $108,580 | $39,340 | $69,240 |
| 2015 | $5,440 | $128,900 | $47,600 | $81,300 |
| 2014 | $5,440 | $128,900 | $47,600 | $81,300 |
Map
- 3674 Park Ave
- 900 Merritt St
- 27 Plateau Ave
- 214 Alberta St
- 31 Teresa Place Unit 31
- 462 Glendale Ave Unit 20
- 462 Glendale Ave Unit 11
- 835 Thorme St
- 557 Glendale Ave
- 406 Peet St
- 210 Stratfield Place
- 415 Jewett Ave
- 409 Glendale Ave Unit C1
- 14 Riverview Dr Unit 14
- 4117 Park Ave
- 150 Stratfield Place
- 3300 Park Ave Unit 16
- 3300 Park Ave Unit 33
- 67 Valley Cir
- 2756 Madison Ave Unit 1A
Ask me questions while you tour the home.