36 Dundee Dr Marshfield, MA 02050
Ocean Bluff-Brant Rock NeighborhoodEstimated Value: $671,000 - $767,000
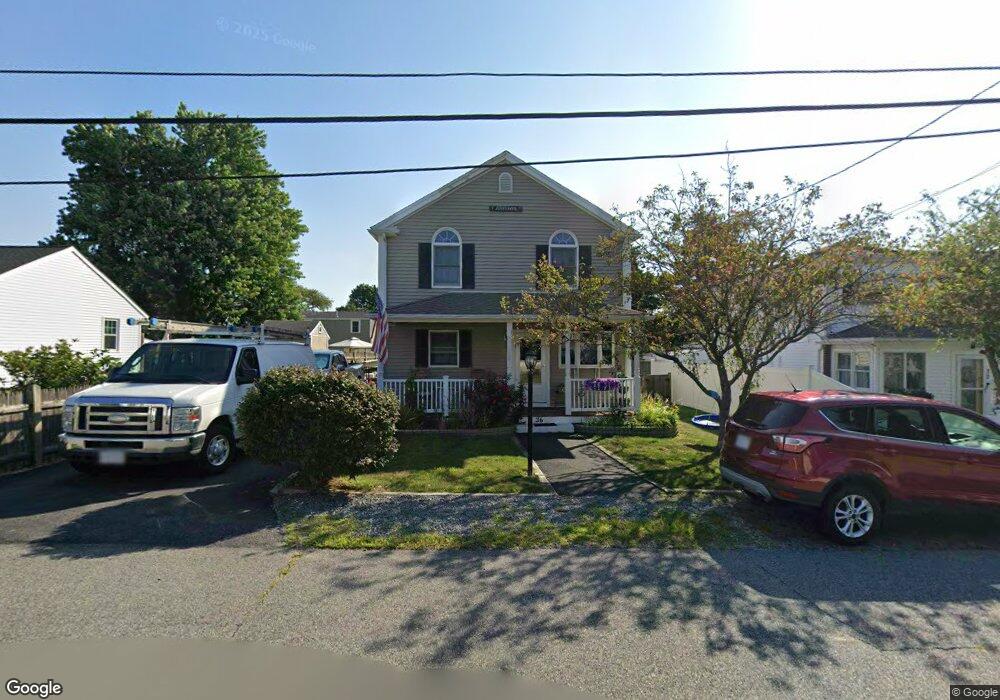
About This Home
This home is located at 36 Dundee Dr, Marshfield, MA 02050 and is currently estimated at $715,571, approximately $465 per square foot. 36 Dundee Dr is a home with nearby schools including Governor Edward Winslow School, Furnace Brook Middle School, and Marshfield High School.
Ownership History
We collect this data history from publicly available records. To have your information removed, we recommend requesting removal directly through your county’s website.
Purchase Details
Purchase Details
Home Values in the Area
Average Home Value in this Area
Purchase History
We collect this data history from publicly available records. To have your information removed, we recommend requesting removal directly through your county’s website.
| Date | Buyer | Sale Price | Title Company |
|---|---|---|---|
| -- | -- | ||
| -- | -- | ||
| -- | -- | ||
| -- | -- |
Mortgage History
We collect this data history from publicly available records. To have your information removed, we recommend requesting removal directly through your county’s website.
| Date | Status | Borrower | Loan Amount |
|---|---|---|---|
| Previous Owner | $100,000 | ||
| Previous Owner | $57,000 | ||
| Previous Owner | $30,000 |
Tax History
We collect this data history from publicly available records. To have your information removed, we recommend requesting removal directly through your county’s website.
| Year | Tax Paid | Tax Assessment Tax Assessment Total Assessment is a certain percentage of the fair market value that is determined by local assessors to be the total taxable value of land and additions on the property. | Land | Improvement |
|---|---|---|---|---|
| 2025 | $6,932 | $700,200 | $317,600 | $382,600 |
| 2024 | $6,619 | $637,100 | $297,800 | $339,300 |
| 2023 | $6,186 | $562,200 | $268,000 | $294,200 |
| 2022 | $6,186 | $477,700 | $228,300 | $249,400 |
| 2021 | $5,839 | $442,700 | $218,400 | $224,300 |
| 2020 | $5,420 | $406,600 | $188,600 | $218,000 |
| 2019 | $5,273 | $394,100 | $188,600 | $205,500 |
| 2018 | $5,213 | $389,900 | $188,600 | $201,300 |
| 2017 | $4,931 | $359,400 | $178,700 | $180,700 |
| 2016 | $4,675 | $336,800 | $168,700 | $168,100 |
| 2015 | $4,400 | $331,100 | $168,700 | $162,400 |
| 2014 | $4,290 | $322,800 | $168,700 | $154,100 |
Map
- 90 Colonial Rd
- 71 Webster Ave
- 204 Foster Ave
- 64 Central St
- 38 Ocean St
- 36 Ocean St
- 245 Careswell St
- 6 Country Way
- 1028 Ocean St
- 111 Hartford Rd
- 47 Old Colony Ln Unit 127
- 47 Old Colony Ln Unit 240
- 71 Ice House Ln
- 1080 Ocean St
- 39 Everett St
- 1221 Ocean St
- 120 Monitor Rd
- 107 Towne Way
- 91 Winslow St
- 19 Copeland St
Ask me questions while you tour the home.