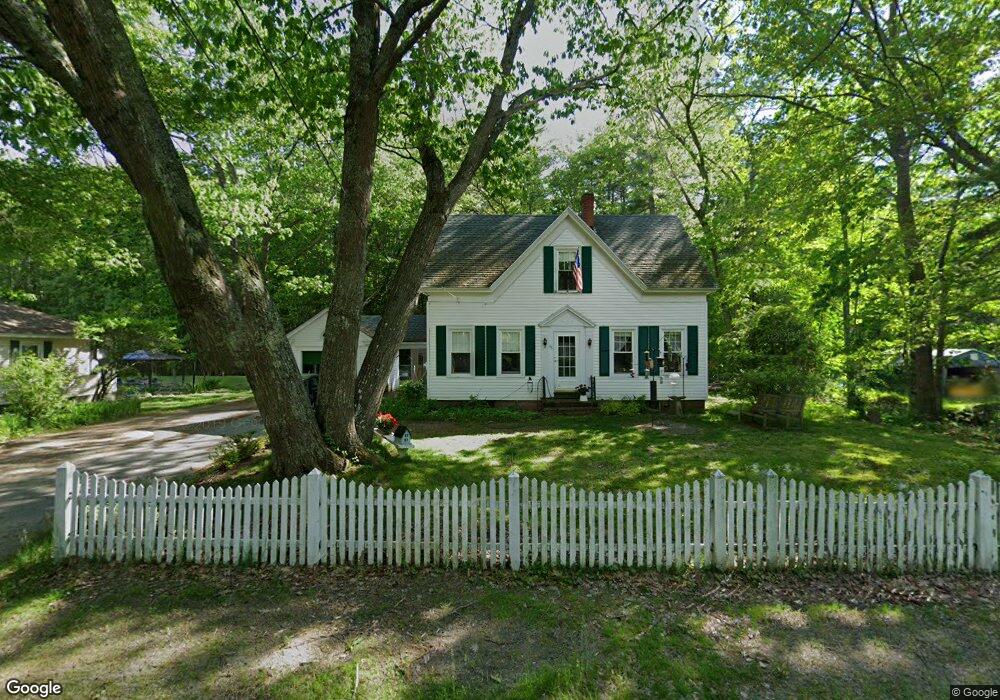
36 Flag Pond Rd Saco, ME 04072
Central Saco NeighborhoodEstimated Value: $378,000 - $461,000
3
Beds
2
Baths
1,524
Sq Ft
$278/Sq Ft
Est. Value
About This Home
This home is located at 36 Flag Pond Rd, Saco, ME 04072 and is currently estimated at $423,178, approximately $277 per square foot. 36 Flag Pond Rd is a home located in York County with nearby schools including C K Burns School, Saco Middle School, and Florence Lombard Christian School.
Ownership History
Date
Name
Owned For
Owner Type
Purchase Details
Closed on
Dec 15, 2011
Sold by
Dube Tracyann B
Bought by
Dube Philip R
Current Estimated Value
Home Financials for this Owner
Home Financials are based on the most recent Mortgage that was taken out on this home.
Original Mortgage
$140,000
Interest Rate
4.01%
Mortgage Type
Purchase Money Mortgage
Create a Home Valuation Report for This Property
The Home Valuation Report is an in-depth analysis detailing your home's value as well as a comparison with similar homes in the area
Home Values in the Area
Average Home Value in this Area
Purchase History
| Date | Buyer | Sale Price | Title Company |
|---|---|---|---|
| Dube Philip R | -- | -- |
Source: Public Records
Mortgage History
| Date | Status | Borrower | Loan Amount |
|---|---|---|---|
| Closed | Dube Philip R | $140,000 |
Source: Public Records
Tax History
| Year | Tax Paid | Tax Assessment Tax Assessment Total Assessment is a certain percentage of the fair market value that is determined by local assessors to be the total taxable value of land and additions on the property. | Land | Improvement |
|---|---|---|---|---|
| 2024 | $3,757 | $267,400 | $58,500 | $208,900 |
| 2023 | $3,944 | $267,400 | $58,500 | $208,900 |
| 2022 | $3,584 | $195,500 | $44,600 | $150,900 |
| 2021 | $3,487 | $184,700 | $39,600 | $145,100 |
| 2020 | $3,303 | $167,900 | $34,400 | $133,500 |
| 2019 | $3,254 | $167,900 | $34,400 | $133,500 |
| 2018 | $3,205 | $165,400 | $31,900 | $133,500 |
| 2017 | $3,037 | $156,700 | $31,900 | $124,800 |
| 2016 | $3,395 | $174,800 | $30,500 | $144,300 |
| 2015 | $3,321 | $172,800 | $30,100 | $142,700 |
| 2014 | $3,210 | $172,400 | $29,700 | $142,700 |
| 2013 | $3,183 | $171,300 | $29,700 | $141,600 |
Source: Public Records
Map
Nearby Homes
- 994 Portland Rd Unit 16
- 994 Portland Rd Unit 6
- 17 Clayton Dr
- 22 A Meserve Cir
- 16 Pine Haven St
- 5 Quarry Ln
- 4 Sparrow Rd
- 1038 Portland Rd Unit 19
- 10 Lodge Dr
- 16 Pondview Rd
- 7 Poplar St
- 1 Shamrock Dr
- 25 Juniper St
- 404-3-3 Juniper St
- 800 Portland Rd
- 33 Emerson Way
- 159 Stewart Dr
- 155 Stewart Dr
- 153 Stewart Dr
- 134 Stewart Dr
Your Personal Tour Guide
Ask me questions while you tour the home.