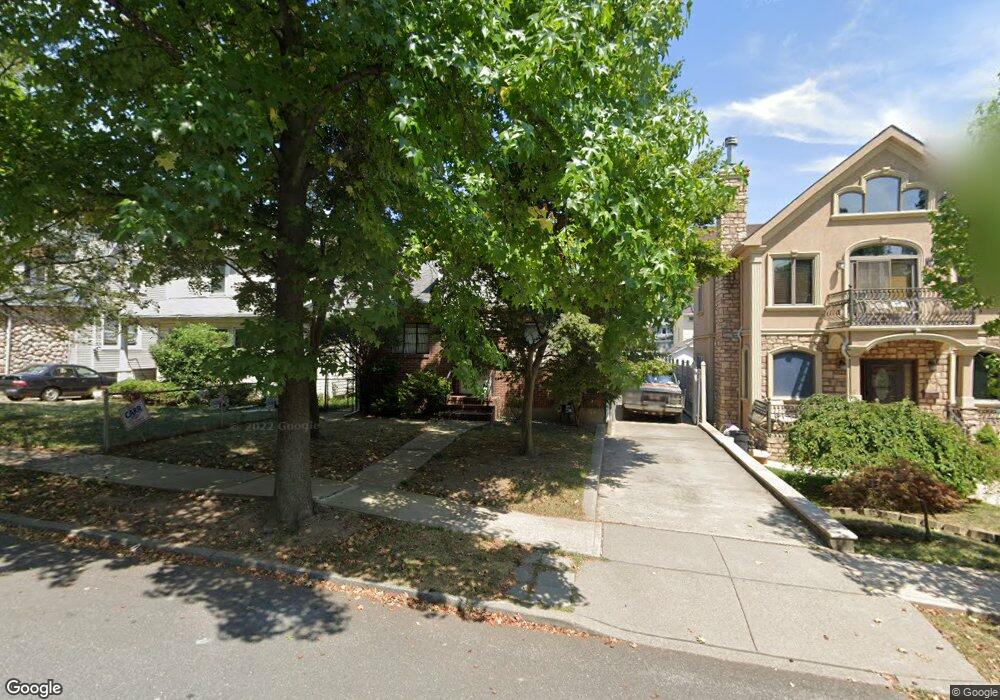
36 Forest Rd Staten Island, NY 10304
Dongan Hills NeighborhoodEstimated Value: $779,223 - $965,000
Studio
4
Baths
1,260
Sq Ft
$685/Sq Ft
Est. Value
About This Home
This home is located at 36 Forest Rd, Staten Island, NY 10304 and is currently estimated at $863,306, approximately $685 per square foot. 36 Forest Rd is a home located in Richmond County with nearby schools including P.S. 11 Thomas Dongan School, Myra S. Barnes Intermediate School 24, and Susan E Wagner High School.
Ownership History
Date
Name
Owned For
Owner Type
Purchase Details
Closed on
Aug 31, 1995
Sold by
Lynch Katherine and Gallagher Helen
Bought by
Johnson Ann and Rodriguez Robert
Current Estimated Value
Home Financials for this Owner
Home Financials are based on the most recent Mortgage that was taken out on this home.
Original Mortgage
$50,000
Interest Rate
7.71%
Purchase Details
Closed on
Jul 17, 1995
Sold by
Johnson Ann
Bought by
Rodriguez Robert
Home Financials for this Owner
Home Financials are based on the most recent Mortgage that was taken out on this home.
Original Mortgage
$50,000
Interest Rate
7.71%
Create a Home Valuation Report for This Property
The Home Valuation Report is an in-depth analysis detailing your home's value as well as a comparison with similar homes in the area
Home Values in the Area
Average Home Value in this Area
Purchase History
| Date | Buyer | Sale Price | Title Company |
|---|---|---|---|
| Johnson Ann | $47,500 | Chicago Title Insurance Co | |
| Rodriguez Robert | $75,500 | -- |
Source: Public Records
Mortgage History
| Date | Status | Borrower | Loan Amount |
|---|---|---|---|
| Previous Owner | Johnson Ann | $50,000 |
Source: Public Records
Tax History
| Year | Tax Paid | Tax Assessment Tax Assessment Total Assessment is a certain percentage of the fair market value that is determined by local assessors to be the total taxable value of land and additions on the property. | Land | Improvement |
|---|---|---|---|---|
| 2025 | $6,339 | $50,640 | $7,783 | $42,857 |
| 2024 | $6,351 | $46,380 | $8,017 | $38,363 |
| 2023 | $6,031 | $31,098 | $6,576 | $24,522 |
| 2022 | $5,570 | $47,220 | $11,280 | $35,940 |
| 2021 | $5,855 | $49,740 | $11,280 | $38,460 |
| 2020 | $5,867 | $51,780 | $11,280 | $40,500 |
| 2019 | $5,453 | $45,000 | $11,280 | $33,720 |
| 2018 | $4,985 | $25,915 | $7,051 | $18,864 |
| 2017 | $4,685 | $24,451 | $6,881 | $17,570 |
| 2016 | $4,565 | $24,384 | $6,873 | $17,511 |
| 2015 | $4,088 | $24,264 | $6,579 | $17,685 |
| 2014 | $4,088 | $22,891 | $6,717 | $16,174 |
Source: Public Records
Map
Nearby Homes
- 70 Jenna Ln
- 40 Jenna Ln
- 30 Delaware Ave
- 1 Utopia Ct
- 33 Delaware Ave
- 75 Utopia Ct
- 59 & 51 Garretson Ave
- 4 Sophia Ln
- 77 Delaware Ave
- 59 Seaview Ave
- 1373 Richmond Rd
- 107 Jefferson St
- 111 Chapin Ave
- 20 Buel Ave Unit A
- 90 Flagg Place
- 38 Oakdale Ave
- 105 Seaview Ave
- 131 Jefferson St
- 130 Jefferson St
- 25 Dutchess Ave
Your Personal Tour Guide
Ask me questions while you tour the home.