36 Frothingham St Lowell, MA 01852
Belvidere NeighborhoodEstimated Value: $588,841 - $618,000
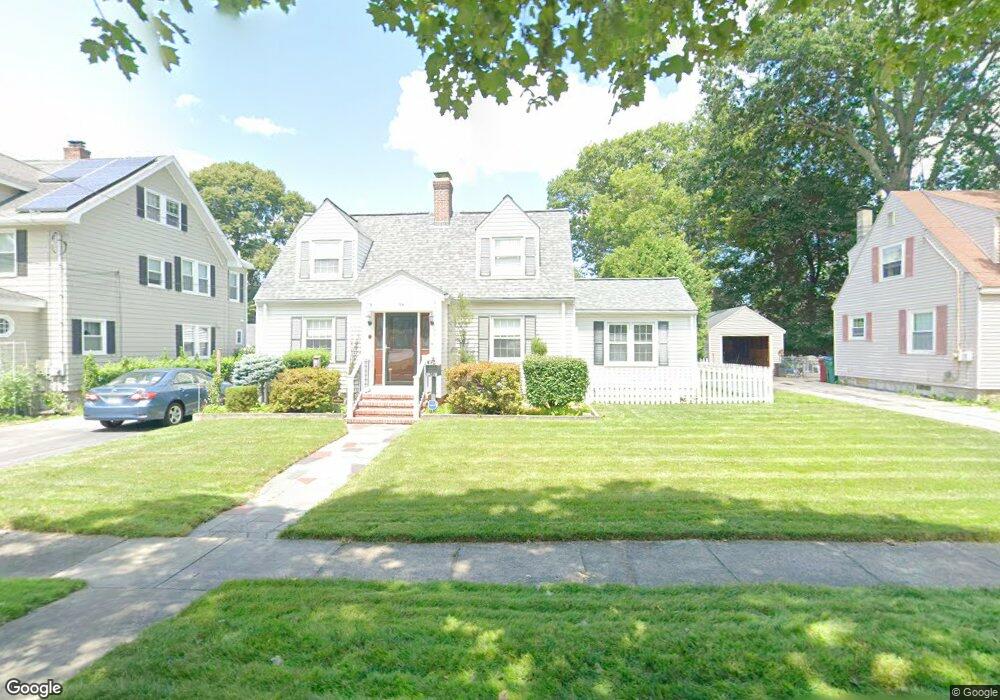
About This Home
This home is located at 36 Frothingham St, Lowell, MA 01852 and is currently estimated at $598,710, approximately $393 per square foot. 36 Frothingham St is a home located in Middlesex County with nearby schools including Moody Elementary School, Abraham Lincoln Elementary School, and Greenhalge Elementary School.
Ownership History
We collect this data history from publicly available records. To have your information removed, we recommend requesting removal directly through your county’s website.
Purchase Details
Home Financials for this Owner
Home Financials are based on the most recent Mortgage that was taken out on this home.Home Values in the Area
Average Home Value in this Area
Purchase History
We collect this data history from publicly available records. To have your information removed, we recommend requesting removal directly through your county’s website.
| Date | Buyer | Sale Price | Title Company |
|---|---|---|---|
| $280,000 | -- |
Mortgage History
We collect this data history from publicly available records. To have your information removed, we recommend requesting removal directly through your county’s website.
| Date | Status | Borrower | Loan Amount |
|---|---|---|---|
| Open | $256,691 | ||
| Closed | $266,000 |
Tax History
We collect this data history from publicly available records. To have your information removed, we recommend requesting removal directly through your county’s website.
| Year | Tax Paid | Tax Assessment Tax Assessment Total Assessment is a certain percentage of the fair market value that is determined by local assessors to be the total taxable value of land and additions on the property. | Land | Improvement |
|---|---|---|---|---|
| 2025 | $5,591 | $487,000 | $235,300 | $251,700 |
| 2024 | $5,336 | $448,000 | $219,900 | $228,100 |
| 2023 | $5,152 | $414,800 | $191,200 | $223,600 |
| 2022 | $4,680 | $368,800 | $173,800 | $195,000 |
| 2021 | $4,391 | $326,200 | $151,200 | $175,000 |
| 2020 | $4,329 | $324,000 | $151,200 | $172,800 |
| 2019 | $4,299 | $306,200 | $150,400 | $155,800 |
| 2018 | $4,160 | $289,100 | $143,300 | $145,800 |
| 2017 | $4,042 | $270,900 | $132,900 | $138,000 |
| 2016 | $3,760 | $248,000 | $122,300 | $125,700 |
| 2015 | $3,769 | $243,500 | $122,300 | $121,200 |
| 2013 | $3,643 | $242,700 | $135,100 | $107,600 |
Map
- 21 Guild St
- 35 Barasford Ave
- 50 Wentworth Ave
- 631 E Merrimack St
- 633 E Merrimack St
- 558 E Merrimack St Unit 34
- 62 Parkview Ave
- 105 Starr Ave
- 32 Belmont Ave
- 192 Wentworth Ave
- 305 Andover St
- 251 Butman Rd
- 18 Nob Way
- 52 Christian St
- 82 Christian St
- 294 Wentworth Ave
- 112 Durant St
- 133 Fairmount St
- 223 Stackpole St
- 81 Reservoir St
- 515 Andover St
- 525 Andover St
- 509 Andover St
- 531 Andover St
- 501 Andover St
- 660 A-1 Andover St
- 30 Frothingham St
- 44 Frothingham St
- 28 Butman Rd
- 15 Luce St
- 52 Frothingham St
- 1-2 Butman Rd
- 516 Andover St
- 528 Andover St
- 543 Andover St
- 500 Andover St Unit A
- 500 Andover St Unit B
- 500 Andover St Unit U:B
- 487 Andover St
- 538 Andover St
Ask me questions while you tour the home.