36 Hill St Brooklyn, NY 11208
East New York NeighborhoodEstimated Value: $707,074 - $1,005,000
About This Home
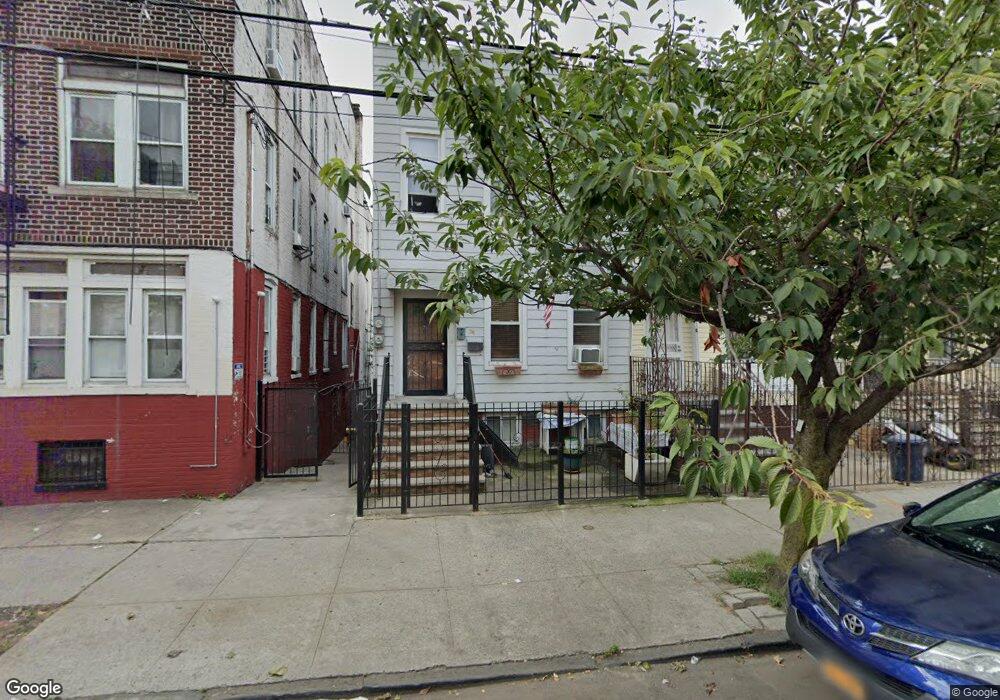
This home is located at 36 Hill St, Brooklyn, NY 11208 and is currently estimated at $852,769, approximately $623 per square foot. 36 Hill St is a home located in Kings County with nearby schools including P.S. 214 - Michael Friedsam, Cypress Hills Ascend Charter Lower School, and East Brooklyn Ascend.
Ownership History
We collect this data history from publicly available records. To have your information removed, we recommend requesting removal directly through your county’s website.
Purchase Details
Home Values in the Area
Average Home Value in this Area
Purchase History
We collect this data history from publicly available records. To have your information removed, we recommend requesting removal directly through your county’s website.
| Date | Buyer | Sale Price | Title Company |
|---|---|---|---|
| -- | -- | ||
| -- | -- |
Mortgage History
We collect this data history from publicly available records. To have your information removed, we recommend requesting removal directly through your county’s website.
| Date | Status | Borrower | Loan Amount |
|---|---|---|---|
| Closed | $0 |
Tax History
We collect this data history from publicly available records. To have your information removed, we recommend requesting removal directly through your county’s website.
| Year | Tax Paid | Tax Assessment Tax Assessment Total Assessment is a certain percentage of the fair market value that is determined by local assessors to be the total taxable value of land and additions on the property. | Land | Improvement |
|---|---|---|---|---|
| 2026 | $4,164 | $51,060 | $13,680 | $37,380 |
| 2025 | $3,917 | $45,900 | $13,680 | $32,220 |
| 2024 | $3,917 | $40,020 | $13,680 | $26,340 |
| 2023 | $3,961 | $42,660 | $13,680 | $28,980 |
| 2022 | $3,654 | $39,180 | $13,680 | $25,500 |
| 2021 | $3,625 | $30,240 | $13,680 | $16,560 |
| 2020 | $1,783 | $27,720 | $13,680 | $14,040 |
| 2019 | $3,351 | $29,760 | $13,680 | $16,080 |
| 2018 | $3,253 | $17,418 | $8,291 | $9,127 |
| 2017 | $3,053 | $16,449 | $9,423 | $7,026 |
| 2016 | $2,794 | $15,525 | $8,388 | $7,137 |
| 2015 | $1,652 | $15,384 | $10,548 | $4,836 |
| 2014 | $1,652 | $14,515 | $9,741 | $4,774 |
Map
- 81 Mckinley Ave
- 397 Crescent St
- 19 Doscher St
- 422 Autumn Ave
- 414 Chestnut St
- 61 Glen St
- 965 Glenmore Ave
- 3412 Atlantic Ave
- 127 Crystal St
- 92 Fountain Ave
- 126 Crystal St
- 575 Logan Street
- 367 Lincoln Ave
- 99 Doscher St
- 555 Hemlock St
- 180 Fountain Ave
- 1059 Belmont Ave
- 331 Lincoln Ave
- 447 Logan St
- 900 Glenmore Ave
Ask me questions while you tour the home.