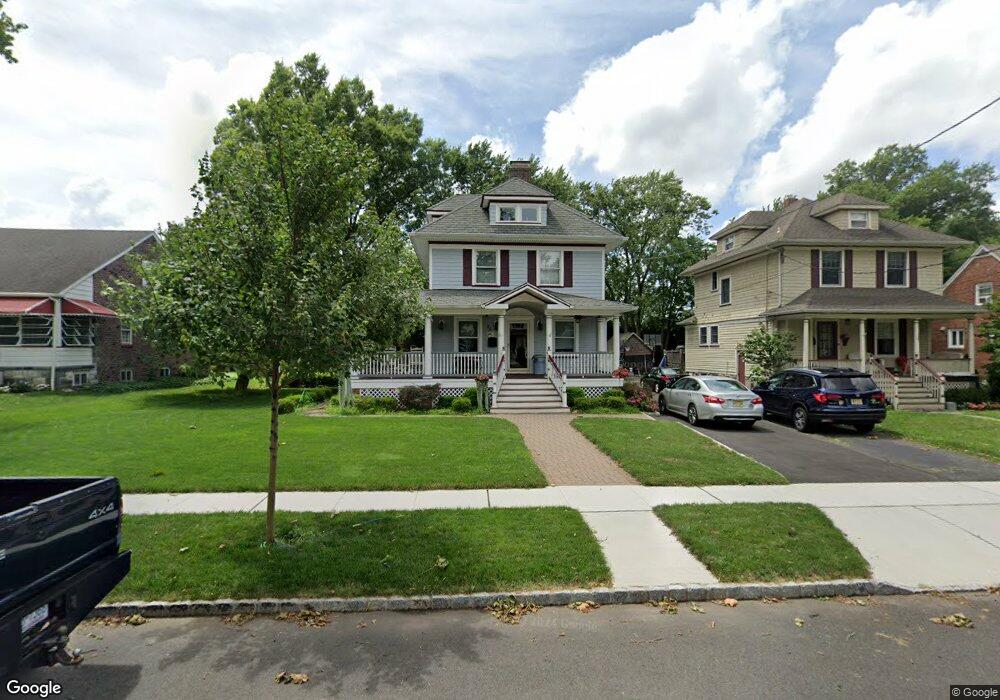
36 John St Cranford, NJ 07016
Estimated Value: $755,900 - $1,311,000
About This Home
This home is located at 36 John St, Cranford, NJ 07016 and is currently estimated at $969,975, approximately $546 per square foot. 36 John St is a home located in Union County with nearby schools including Cranford Sr High School and St Michael School.
Ownership History
We collect this data history from publicly available records. To have your information removed, we recommend requesting removal directly through your county’s website.
Purchase Details
Home Values in the Area
Average Home Value in this Area
Purchase History
We collect this data history from publicly available records. To have your information removed, we recommend requesting removal directly through your county’s website.
| Date | Buyer | Sale Price | Title Company |
|---|---|---|---|
| $220,000 | -- |
Tax History
We collect this data history from publicly available records. To have your information removed, we recommend requesting removal directly through your county’s website.
| Year | Tax Paid | Tax Assessment Tax Assessment Total Assessment is a certain percentage of the fair market value that is determined by local assessors to be the total taxable value of land and additions on the property. | Land | Improvement |
|---|---|---|---|---|
| 2026 | $13,945 | $192,400 | $88,200 | $104,200 |
| 2025 | $13,945 | $192,400 | $88,200 | $104,200 |
| 2024 | $12,827 | $192,400 | $88,200 | $104,200 |
| 2023 | $12,827 | $192,400 | $88,200 | $104,200 |
| 2022 | $12,721 | $192,400 | $88,200 | $104,200 |
| 2021 | $12,666 | $192,400 | $88,200 | $104,200 |
| 2020 | $12,625 | $192,400 | $88,200 | $104,200 |
| 2019 | $12,544 | $192,400 | $88,200 | $104,200 |
| 2018 | $12,317 | $192,400 | $88,200 | $104,200 |
| 2017 | $11,894 | $192,400 | $88,200 | $104,200 |
| 2016 | $11,461 | $192,400 | $88,200 | $104,200 |
| 2015 | $11,161 | $192,400 | $88,200 | $104,200 |
| 2014 | $10,932 | $192,400 | $88,200 | $104,200 |
Map
- 40 John St
- 321 North Ave E Unit 127
- 336 North Ave E
- 16 Elizabeth Ave
- 213 Sailer St
- 941 Lincoln Ave E
- 24A Hollywood Ave
- 211 Cranford Ave
- 7 Cranford Ave
- 8 Cummings St
- 187 North Ave E
- 18 Burchfield Ave
- 204 N Union Ave
- 506 Linden Place
- 43B Parkway Village
- 109 Centennial Ave
- 112 Severin Ct
- 603 Lincoln Park E
- 615 Lincoln Park E
- 18 Springfield Ave Unit 4E
Ask me questions while you tour the home.