36 Pickering St Winchester, MA 01890
North Main NeighborhoodEstimated Value: $1,245,000 - $1,699,242
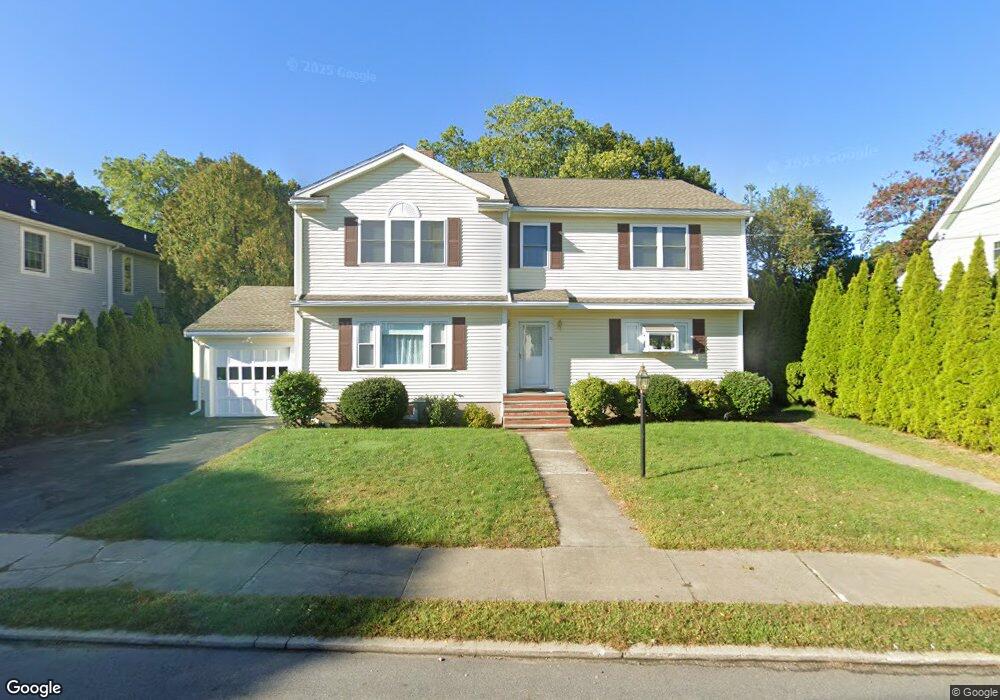
About This Home
This home is located at 36 Pickering St, Winchester, MA 01890 and is currently estimated at $1,448,561, approximately $617 per square foot. 36 Pickering St is a home located in Middlesex County with nearby schools including Lynch Elementary School, McCall Middle School, and Winchester High School.
Ownership History
We collect this data history from publicly available records. To have your information removed, we recommend requesting removal directly through your county’s website.
Purchase Details
Purchase Details
Purchase Details
Purchase Details
Home Values in the Area
Average Home Value in this Area
Purchase History
We collect this data history from publicly available records. To have your information removed, we recommend requesting removal directly through your county’s website.
| Date | Buyer | Sale Price | Title Company |
|---|---|---|---|
| $492,000 | -- | ||
| $492,000 | -- | ||
| $267,000 | -- | ||
| $267,000 | -- | ||
| $267,000 | -- | ||
| $175,000 | -- | ||
| $151,000 | -- |
Mortgage History
We collect this data history from publicly available records. To have your information removed, we recommend requesting removal directly through your county’s website.
| Date | Status | Borrower | Loan Amount |
|---|---|---|---|
| Open | $393,600 | ||
| Closed | $393,600 |
Tax History
We collect this data history from publicly available records. To have your information removed, we recommend requesting removal directly through your county’s website.
| Year | Tax Paid | Tax Assessment Tax Assessment Total Assessment is a certain percentage of the fair market value that is determined by local assessors to be the total taxable value of land and additions on the property. | Land | Improvement |
|---|---|---|---|---|
| 2025 | $144 | $1,298,500 | $629,600 | $668,900 |
| 2024 | $13,807 | $1,218,600 | $596,500 | $622,100 |
| 2023 | $13,650 | $1,156,800 | $546,800 | $610,000 |
| 2022 | $13,465 | $1,076,300 | $497,100 | $579,200 |
| 2021 | $13,606 | $1,001,700 | $422,500 | $579,200 |
| 2020 | $12,668 | $1,001,700 | $422,500 | $579,200 |
| 2019 | $11,128 | $918,900 | $339,700 | $579,200 |
| 2018 | $4,592 | $886,900 | $323,100 | $563,800 |
| 2017 | $10,308 | $839,400 | $306,500 | $532,900 |
| 2016 | $6,478 | $554,600 | $306,500 | $248,100 |
| 2015 | $6,381 | $525,600 | $277,500 | $248,100 |
| 2014 | $6,020 | $475,500 | $240,200 | $235,300 |
Map
- 49 Sheridan Cir
- 16 Glenwood Ave
- 16 & 16A Glenwood Ave
- 14 Cross St
- 380 Cross St
- 109 Main St Unit 1
- 3 Conn St Unit 3
- 23 Shepard Ct Unit U23
- 18-20 Buck St Unit 1
- 10 Farrow St
- 20 Buck St
- 22 Arthur St
- 12 Highland Ave
- 14 Bradford Rd Unit 14
- 258 Cross St
- 171 Swanton St Unit 7
- 18 Middlesex St
- 200 Swanton St Unit 228
- 200 Swanton St Unit 412
- 200 Swanton St Unit 303
- 38 Pickering St Unit B
- 32 Pickering St
- 34 Pickering St
- 17 Pickering St
- 39 Pickering St
- 76 Sheridan Cir
- 16 Pickering St
- 15 Pickering St
- 2 Border St Unit 2
- 69 Sheridan Cir
- 65 Sheridan Cir
- 14 Pickering St
- 73 Sheridan Cir
- 7 Lake Cir
- 21 Border St
- 63 Sheridan Cir
- 84 Sheridan Cir
- 61 Sheridan Cir Unit 2
- 61 Sheridan Cir
- 61 Sheridan Cir Unit 1
Ask me questions while you tour the home.