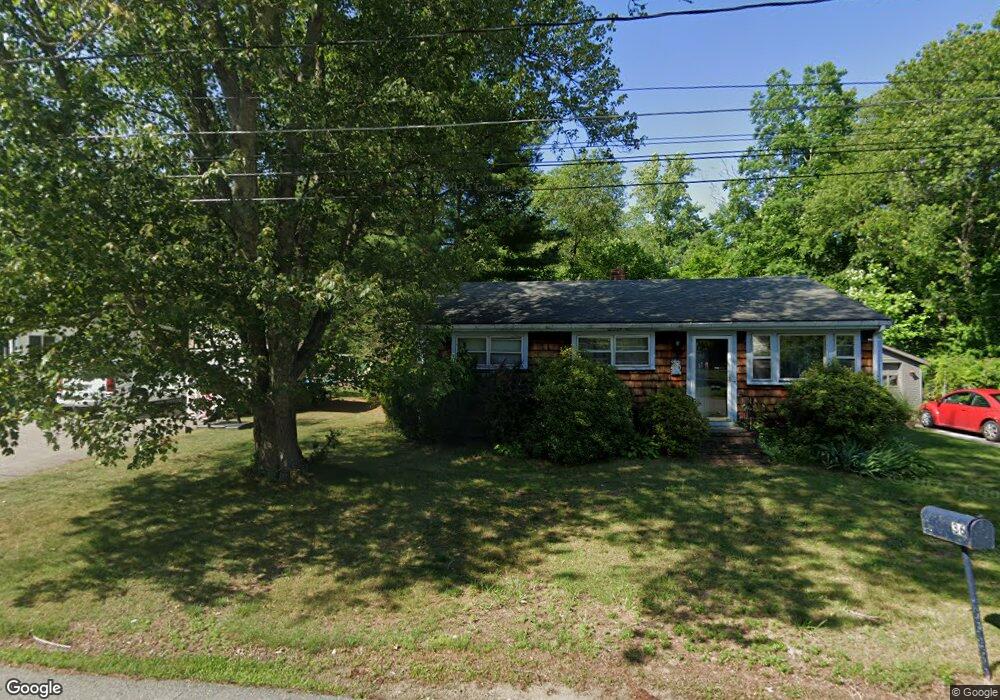
36 Sylvain St Raynham, MA 02767
Raynham AreaEstimated Value: $477,000 - $591,000
About This Home
This home is located at 36 Sylvain St, Raynham, MA 02767 and is currently estimated at $511,261, approximately $303 per square foot. 36 Sylvain St is a home located in Bristol County with nearby schools including LaLiberte Elementary School, Merrill Elementary School, and Williams Intermediate School.
Ownership History
We collect this data history from publicly available records. To have your information removed, we recommend requesting removal directly through your county’s website.
Purchase Details
Purchase Details
Home Values in the Area
Average Home Value in this Area
Purchase History
We collect this data history from publicly available records. To have your information removed, we recommend requesting removal directly through your county’s website.
| Date | Buyer | Sale Price | Title Company |
|---|---|---|---|
| -- | -- | ||
| -- | -- |
Mortgage History
We collect this data history from publicly available records. To have your information removed, we recommend requesting removal directly through your county’s website.
| Date | Status | Borrower | Loan Amount |
|---|---|---|---|
| Previous Owner | $70,000 |
Tax History
We collect this data history from publicly available records. To have your information removed, we recommend requesting removal directly through your county’s website.
| Year | Tax Paid | Tax Assessment Tax Assessment Total Assessment is a certain percentage of the fair market value that is determined by local assessors to be the total taxable value of land and additions on the property. | Land | Improvement |
|---|---|---|---|---|
| 2025 | $4,420 | $365,300 | $186,500 | $178,800 |
| 2024 | $4,189 | $337,300 | $167,800 | $169,500 |
| 2023 | $4,166 | $306,300 | $158,500 | $147,800 |
| 2022 | $4,103 | $276,700 | $149,200 | $127,500 |
| 2021 | $3,722 | $253,400 | $130,500 | $122,900 |
| 2020 | $3,517 | $244,100 | $123,100 | $121,000 |
| 2019 | $3,363 | $236,300 | $115,600 | $120,700 |
| 2018 | $3,144 | $206,700 | $102,600 | $104,100 |
| 2017 | $2,869 | $190,900 | $97,000 | $93,900 |
| 2016 | $2,803 | $187,100 | $93,200 | $93,900 |
| 2015 | $2,725 | $178,800 | $96,200 | $82,600 |
Map
- 826 Broadway
- 658 Broadway
- 646 Broadway
- 634 Broadway
- 9 Mowry St
- 79 Foxwood Ln
- 30 Sunflower Dr Unit 30
- 4 Daisy Ln Unit 4
- 31 Daisy Ln
- 89 Stoneybrook Rd
- 394 Mohawk Rd
- 6 Mohawk Rd
- 128 Prospect Hill St
- 125 Prospect Hill St
- 53 Bridge St
- 105 Lounsbury Dr
- 260 King Philip St
- 750 King Philip St
- 738 King Philip St
- 38 Hickory Rd
Ask me questions while you tour the home.