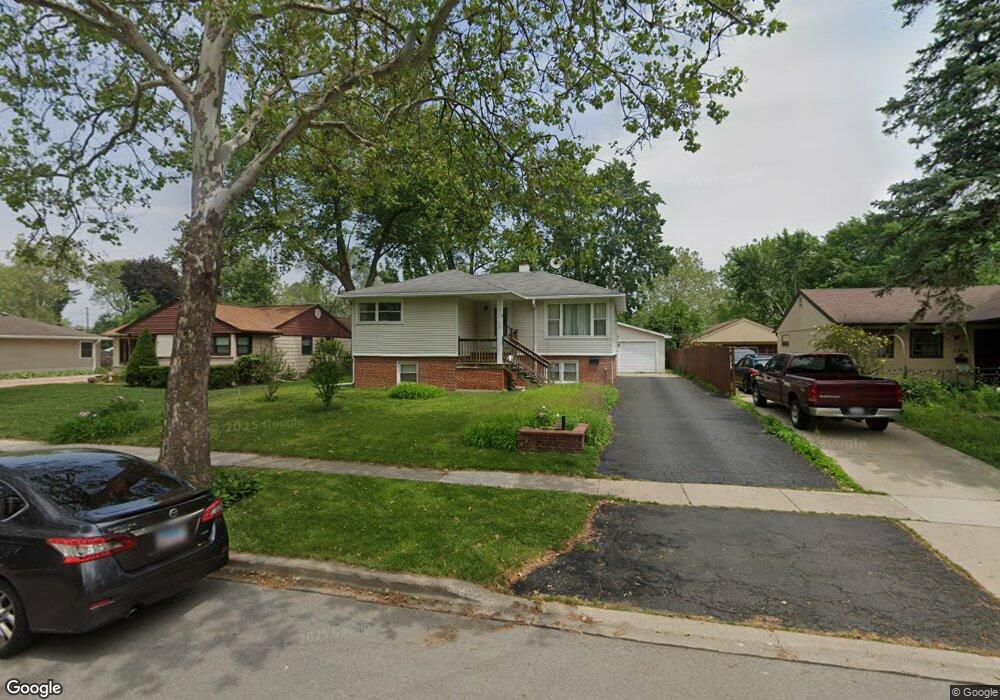
3606 Jay Ln Rolling Meadows, IL 60008
Estimated Value: $344,000 - $365,000
3
Beds
2
Baths
1,055
Sq Ft
$336/Sq Ft
Est. Value
About This Home
This home is located at 3606 Jay Ln, Rolling Meadows, IL 60008 and is currently estimated at $354,409, approximately $335 per square foot. 3606 Jay Ln is a home located in Cook County with nearby schools including Kimball Hill Elementary School, Carl Sandburg Junior High School, and Rolling Meadows High School.
Ownership History
Date
Name
Owned For
Owner Type
Purchase Details
Closed on
Sep 24, 2005
Sold by
Cuny Robert W and West Cuny Ellen M
Bought by
Kalantzis Nickolaos P and Kalantzis Vassiliki
Current Estimated Value
Home Financials for this Owner
Home Financials are based on the most recent Mortgage that was taken out on this home.
Original Mortgage
$244,800
Outstanding Balance
$149,378
Interest Rate
8.5%
Mortgage Type
Fannie Mae Freddie Mac
Estimated Equity
$205,031
Purchase Details
Closed on
Jun 23, 2003
Sold by
Cuny Robert W and West Ellen M
Bought by
Cuny Robert W and West Ellen M
Purchase Details
Closed on
Nov 28, 1994
Sold by
Hughes Mary A
Bought by
Cuny Robert Willis and West Ellen M
Home Financials for this Owner
Home Financials are based on the most recent Mortgage that was taken out on this home.
Original Mortgage
$148,200
Interest Rate
9.06%
Mortgage Type
Assumption
Create a Home Valuation Report for This Property
The Home Valuation Report is an in-depth analysis detailing your home's value as well as a comparison with similar homes in the area
Home Values in the Area
Average Home Value in this Area
Purchase History
We collect this data history from publicly available records. To have your information removed, we recommend requesting removal directly through your county’s website.
| Date | Buyer | Sale Price | Title Company |
|---|---|---|---|
| Kalantzis Nickolaos P | $288,000 | Chicago Title Insurance Comp | |
| Cuny Robert W | -- | -- | |
| Cuny Robert Willis | $144,500 | -- |
Source: Public Records
Mortgage History
We collect this data history from publicly available records. To have your information removed, we recommend requesting removal directly through your county’s website.
| Date | Status | Borrower | Loan Amount |
|---|---|---|---|
| Open | Kalantzis Nickolaos P | $244,800 | |
| Previous Owner | Cuny Robert Willis | $148,200 |
Source: Public Records
Tax History
| Year | Tax Paid | Tax Assessment Tax Assessment Total Assessment is a certain percentage of the fair market value that is determined by local assessors to be the total taxable value of land and additions on the property. | Land | Improvement |
|---|---|---|---|---|
| 2025 | $6,140 | $32,000 | $5,070 | $26,930 |
| 2024 | $6,140 | $26,000 | $4,290 | $21,710 |
| 2023 | $5,824 | $26,000 | $4,290 | $21,710 |
| 2022 | $5,824 | $26,000 | $4,290 | $21,710 |
| 2021 | $4,032 | $18,170 | $2,535 | $15,635 |
| 2020 | $4,070 | $18,170 | $2,535 | $15,635 |
| 2019 | $5,468 | $22,226 | $2,535 | $19,691 |
| 2018 | $4,378 | $16,952 | $2,340 | $14,612 |
| 2017 | $4,308 | $16,952 | $2,340 | $14,612 |
| 2016 | $5,406 | $20,784 | $2,340 | $18,444 |
| 2015 | $4,650 | $17,392 | $2,145 | $15,247 |
| 2014 | $4,556 | $17,392 | $2,145 | $15,247 |
| 2013 | $4,428 | $17,392 | $2,145 | $15,247 |
Source: Public Records
Map
Nearby Homes
- 2807 Starling Ln
- 3000 Starling Ln
- 3206 Wren Ln
- 2539 Geranium Way
- 2707 Lily Ln
- 2718 Lily Ln
- 2117 Grouse Ln
- 2207 Kirchoff Rd
- 2002 Hawk Ct
- 3920 Wren Ct
- 3135 Town Square Dr Unit 104
- 2109 Park St
- 503 Lexington Ln
- 409 Lexington Ln
- 305 Lexington Ln
- 4403 Maple Ct
- 3265 Kirchoff Rd Unit 127
- 3265 Kirchoff Rd Unit 116
- 3204 Owl Dr
- 2503 George St
Your Personal Tour Guide
Ask me questions while you tour the home.