360R Nahant Rd Nahant, MA 01908
Estimated Value: $1,266,000 - $1,661,000
About This Home
This home is located at 360R Nahant Rd, Nahant, MA 01908 and is currently estimated at $1,509,256, approximately $410 per square foot. 360R Nahant Rd is a home located in Essex County with nearby schools including Johnson Elementary School, Swampscott Middle School, and Swampscott High School.
Ownership History
We collect this data history from publicly available records. To have your information removed, we recommend requesting removal directly through your county’s website.
Purchase Details
Purchase Details
Home Values in the Area
Average Home Value in this Area
Purchase History
We collect this data history from publicly available records. To have your information removed, we recommend requesting removal directly through your county’s website.
| Date | Buyer | Sale Price | Title Company |
|---|---|---|---|
| -- | None Available | ||
| -- | None Available | ||
| -- | None Available | ||
| $110,000 | -- |
Mortgage History
We collect this data history from publicly available records. To have your information removed, we recommend requesting removal directly through your county’s website.
| Date | Status | Borrower | Loan Amount |
|---|---|---|---|
| Previous Owner | $400,000 | ||
| Previous Owner | $300,000 |
Tax History
We collect this data history from publicly available records. To have your information removed, we recommend requesting removal directly through your county’s website.
| Year | Tax Paid | Tax Assessment Tax Assessment Total Assessment is a certain percentage of the fair market value that is determined by local assessors to be the total taxable value of land and additions on the property. | Land | Improvement |
|---|---|---|---|---|
| 2025 | $12,020 | $1,313,700 | $745,500 | $568,200 |
| 2024 | $11,680 | $1,287,800 | $719,600 | $568,200 |
| 2023 | $11,369 | $1,250,700 | $706,600 | $544,100 |
| 2022 | $11,655 | $1,190,500 | $702,500 | $488,000 |
| 2021 | $12,702 | $1,208,600 | $751,500 | $457,100 |
| 2020 | $12,520 | $1,141,300 | $751,500 | $389,800 |
| 2019 | $11,678 | $1,070,400 | $722,700 | $347,700 |
| 2018 | $10,146 | $989,900 | $650,700 | $339,200 |
| 2017 | $10,364 | $989,900 | $650,700 | $339,200 |
| 2016 | $9,206 | $875,100 | $549,900 | $325,200 |
| 2015 | $9,202 | $842,700 | $517,500 | $325,200 |
| 2014 | $8,781 | $796,100 | $470,700 | $325,400 |
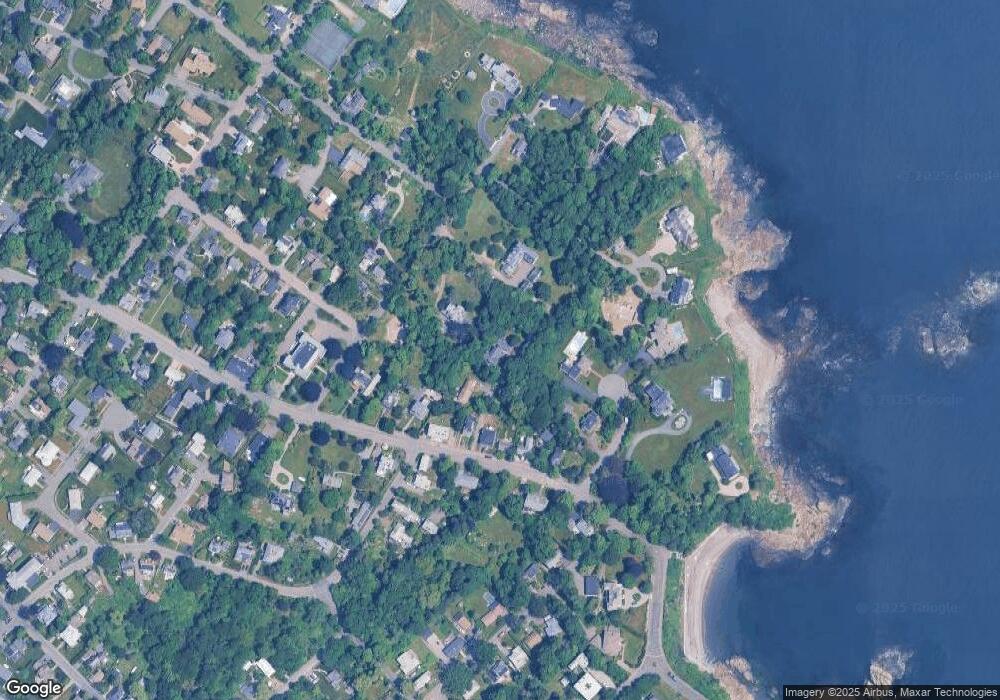
Map
- 6 Desmond Dr
- 51 Cliff St
- 162 Willow Rd Unit 11
- 303 Nahant Rd
- 5 Cottage St
- 66 Ocean St
- 85 Willow Rd
- 1 Goddard Dr
- 51 Fox Hill Rd
- 22 Sherman Ave
- 43 Maple Ave
- 250 Wilson Rd
- 300 Lynn Shore Dr Unit 207
- 300 Lynn Shore Dr Unit 210
- 300 Lynn Shore Dr Unit 410
- 300 Lynn Shore Dr Unit 203
- 285 Lynn Shore Dr Unit 203
- 285 Lynn Shore Dr Unit 308
- 285 Dr Unit 305
- 31 Lincoln House Point
Ask me questions while you tour the home.