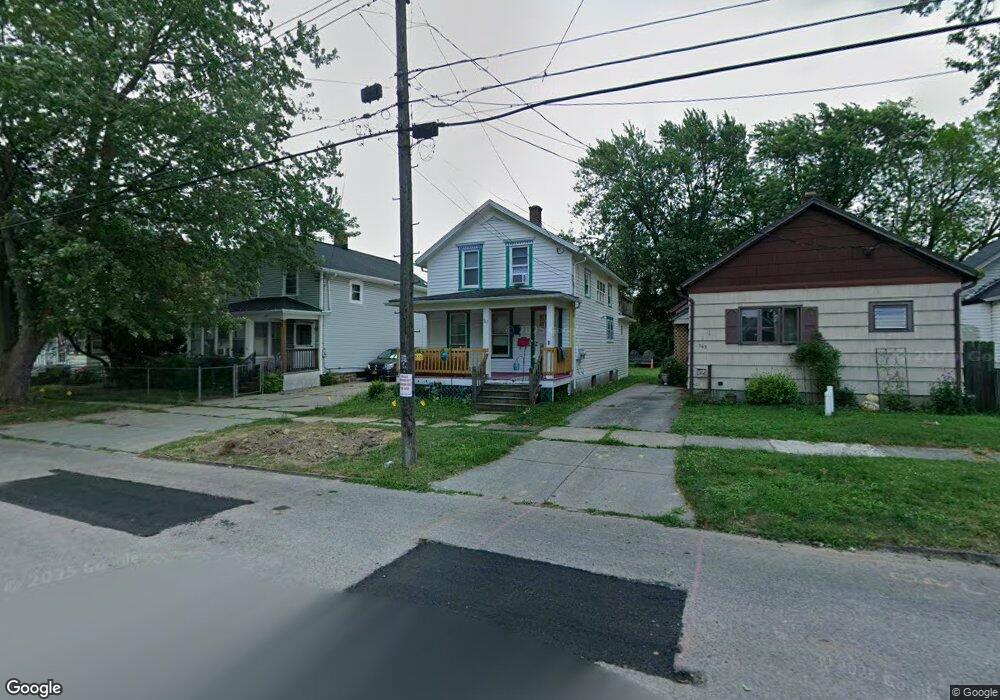
361 Adam St Tonawanda, NY 14150
Estimated Value: $171,850 - $201,000
2
Beds
2
Baths
1,196
Sq Ft
$158/Sq Ft
Est. Value
About This Home
This home is located at 361 Adam St, Tonawanda, NY 14150 and is currently estimated at $188,463, approximately $157 per square foot. 361 Adam St is a home located in Erie County with nearby schools including Tonawanda Elementary School, Tonawanda Middle High School, and New Life Christian School.
Ownership History
Date
Name
Owned For
Owner Type
Purchase Details
Closed on
Dec 11, 2009
Sold by
Rudnicki Peter
Bought by
Bohn Jessica
Current Estimated Value
Home Financials for this Owner
Home Financials are based on the most recent Mortgage that was taken out on this home.
Original Mortgage
$65,786
Outstanding Balance
$42,953
Interest Rate
4.92%
Mortgage Type
FHA
Estimated Equity
$145,510
Purchase Details
Closed on
Apr 6, 2009
Sold by
Kluge Mary Ann
Bought by
Rudnicki Peter
Create a Home Valuation Report for This Property
The Home Valuation Report is an in-depth analysis detailing your home's value as well as a comparison with similar homes in the area
Home Values in the Area
Average Home Value in this Area
Purchase History
| Date | Buyer | Sale Price | Title Company |
|---|---|---|---|
| Bohn Jessica | $67,000 | None Available | |
| Rudnicki Peter | $32,500 | None Available |
Source: Public Records
Mortgage History
| Date | Status | Borrower | Loan Amount |
|---|---|---|---|
| Open | Bohn Jessica | $65,786 |
Source: Public Records
Tax History
| Year | Tax Paid | Tax Assessment Tax Assessment Total Assessment is a certain percentage of the fair market value that is determined by local assessors to be the total taxable value of land and additions on the property. | Land | Improvement |
|---|---|---|---|---|
| 2024 | $1,828 | $121,000 | $15,600 | $105,400 |
| 2023 | $1,750 | $121,000 | $15,600 | $105,400 |
| 2022 | $1,423 | $64,000 | $9,800 | $54,200 |
| 2021 | $1,418 | $64,000 | $9,800 | $54,200 |
| 2020 | $1,402 | $64,000 | $9,800 | $54,200 |
| 2019 | $2,642 | $64,000 | $9,800 | $54,200 |
| 2018 | $1,365 | $64,000 | $9,800 | $54,200 |
| 2017 | $351 | $58,000 | $7,300 | $50,700 |
| 2016 | $1,365 | $58,000 | $7,300 | $50,700 |
| 2015 | -- | $58,000 | $7,300 | $50,700 |
| 2014 | -- | $58,000 | $7,300 | $50,700 |
Source: Public Records
Map
Nearby Homes
Your Personal Tour Guide
Ask me questions while you tour the home.