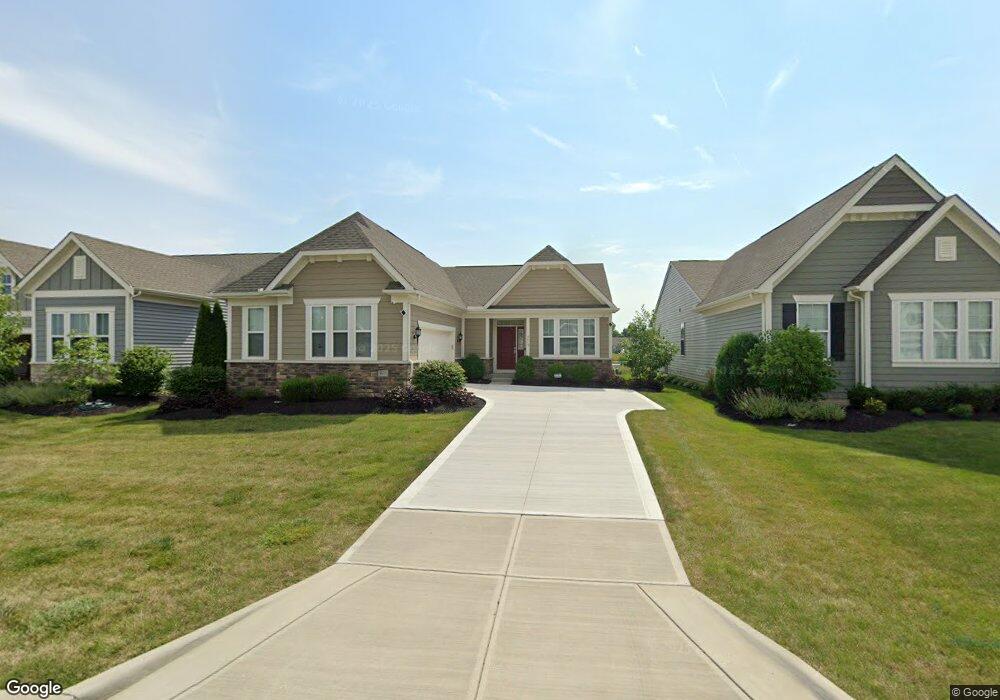
3615 Sanctuary Loop Hilliard, OH 43026
Brown NeighborhoodEstimated Value: $576,000 - $614,000
3
Beds
3
Baths
3,822
Sq Ft
$155/Sq Ft
Est. Value
About This Home
This home is located at 3615 Sanctuary Loop, Hilliard, OH 43026 and is currently estimated at $594,292, approximately $155 per square foot. 3615 Sanctuary Loop is a home located in Franklin County with nearby schools including Brown Elementary School, Hilliard Station Sixth Grade Elementary School, and Hilliard Memorial Middle School.
Ownership History
Date
Name
Owned For
Owner Type
Purchase Details
Closed on
Jan 12, 2024
Sold by
Irick Timothy D and Irick Cynthia L
Bought by
Li Deqiang
Current Estimated Value
Home Financials for this Owner
Home Financials are based on the most recent Mortgage that was taken out on this home.
Original Mortgage
$320,000
Outstanding Balance
$291,868
Interest Rate
5.93%
Mortgage Type
New Conventional
Estimated Equity
$302,424
Purchase Details
Closed on
Jun 7, 2016
Sold by
Fischer Homes Columbus Lp
Bought by
Irick Cynthia L and Irick Timothy D
Home Financials for this Owner
Home Financials are based on the most recent Mortgage that was taken out on this home.
Original Mortgage
$299,000
Interest Rate
3.58%
Mortgage Type
New Conventional
Purchase Details
Closed on
Feb 23, 2016
Sold by
Grand Communities Ltd
Bought by
Fischer Homes Columbus Lp
Create a Home Valuation Report for This Property
The Home Valuation Report is an in-depth analysis detailing your home's value as well as a comparison with similar homes in the area
Home Values in the Area
Average Home Value in this Area
Purchase History
| Date | Buyer | Sale Price | Title Company |
|---|---|---|---|
| Li Deqiang | $540,000 | Northwest Select Title | |
| Irick Cynthia L | $430,500 | Homestead Title | |
| Fischer Homes Columbus Lp | $380,500 | Independent Title Services I |
Source: Public Records
Mortgage History
| Date | Status | Borrower | Loan Amount |
|---|---|---|---|
| Open | Li Deqiang | $320,000 | |
| Previous Owner | Irick Cynthia L | $299,000 |
Source: Public Records
Tax History
| Year | Tax Paid | Tax Assessment Tax Assessment Total Assessment is a certain percentage of the fair market value that is determined by local assessors to be the total taxable value of land and additions on the property. | Land | Improvement |
|---|---|---|---|---|
| 2025 | $9,866 | $146,760 | $37,070 | $109,690 |
| 2024 | $9,866 | $146,760 | $37,070 | $109,690 |
| 2023 | $8,803 | $146,755 | $37,065 | $109,690 |
| 2022 | $11,172 | $151,760 | $23,660 | $128,100 |
| 2021 | $11,239 | $151,760 | $23,660 | $128,100 |
| 2020 | $12,019 | $164,080 | $23,660 | $140,420 |
| 2019 | $12,708 | $149,350 | $21,490 | $127,860 |
| 2018 | $12,392 | $149,350 | $21,490 | $127,860 |
| 2017 | $12,228 | $149,350 | $21,490 | $127,860 |
| 2016 | $0 | $0 | $0 | $0 |
| 2015 | -- | $0 | $0 | $0 |
Source: Public Records
Map
Nearby Homes
- 3780 Aviary Loop
- 6201 Lampton Pond Dr
- 6960 Gelderland Dr
- 6825 Northfield Place
- 6801 Brookview Place
- 6881 Northfield Place
- 6824 Northfield Place
- 7400 Scioto Darby Creek Rd
- 6897 Northfield Place
- 6793 Brookview Place
- 6784 Brookview Place
- 6146 Ravenhill Rd
- 6704 Brookview Place
- 4462 Kabarda Way
- 6737 Brookview Place
- 6721 Brookview Place
- 3260 Alton Darby Creek Rd
- 6754 Forest Ln
- 5962 Heritage Lakes Dr
- 6753 Forest Ln
- 3619 Sanctuary Loop
- 3611 Sanctuary Loop
- 3607 Sanctuary Loop
- 3623 Sanctuary Loop
- 3603 Sanctuary Loop
- 3627 Sanctuary Loop
- 3612 Sanctuary Loop
- 3659 Sanctuary Loop
- 3608 Sanctuary Loop Unit 178
- 3608 Sanctuary Loop
- 3614 Sanctuary Loop
- 3618 Sanctuary Loop
- 3599 Sanctuary Loop
- 3667 Sanctuary Loop
- 3569 Woodland Dr
- 3663 Sanctuary Loop
- 3561 Woodland Dr
- 3622 Sanctuary Loop
- 3557 Woodland Dr
- 3573 Woodland Dr
Your Personal Tour Guide
Ask me questions while you tour the home.