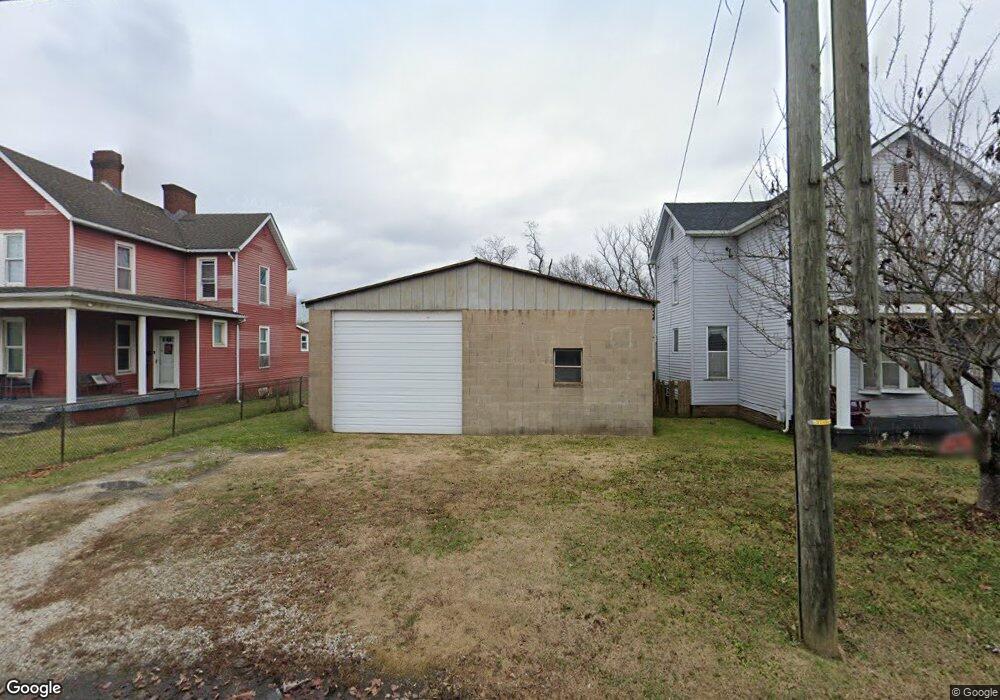
3619 S 3rd St Ironton, OH 45638
Estimated Value: $107,000 - $146,000
3
Beds
2
Baths
1,404
Sq Ft
$87/Sq Ft
Est. Value
About This Home
This home is located at 3619 S 3rd St, Ironton, OH 45638 and is currently estimated at $121,938, approximately $86 per square foot. 3619 S 3rd St is a home located in Lawrence County with nearby schools including Ironton Elementary School, Ironton Middle School, and Ironton High School.
Ownership History
Date
Name
Owned For
Owner Type
Purchase Details
Closed on
Jan 19, 2026
Sold by
Neal Paul and Neal Marsha L
Bought by
Neal Paul and Neal Marsha L
Current Estimated Value
Purchase Details
Closed on
Feb 19, 2024
Sold by
Neal Paul D and Neal Marsha L
Bought by
Neal Melissa R
Purchase Details
Closed on
Apr 1, 2019
Sold by
Neal Paul D
Bought by
Neal Ronald J
Purchase Details
Closed on
Dec 30, 1997
Sold by
Neal Viola L
Bought by
Neal Dave
Create a Home Valuation Report for This Property
The Home Valuation Report is an in-depth analysis detailing your home's value as well as a comparison with similar homes in the area
Home Values in the Area
Average Home Value in this Area
Purchase History
| Date | Buyer | Sale Price | Title Company |
|---|---|---|---|
| Neal Paul | -- | None Listed On Document | |
| Neal Melissa R | $12,500 | None Listed On Document | |
| Neal Melissa R | $12,500 | None Listed On Document | |
| Neal Ronald J | $20,000 | -- | |
| Neal Dave | -- | -- |
Source: Public Records
Tax History
| Year | Tax Paid | Tax Assessment Tax Assessment Total Assessment is a certain percentage of the fair market value that is determined by local assessors to be the total taxable value of land and additions on the property. | Land | Improvement |
|---|---|---|---|---|
| 2025 | $627 | $27,549 | $7,539 | $20,010 |
| 2024 | -- | $26,860 | $6,850 | $20,010 |
| 2023 | $649 | $26,860 | $6,850 | $20,010 |
| 2022 | $662 | $26,860 | $6,850 | $20,010 |
| 2021 | $835 | $22,180 | $5,850 | $16,330 |
| 2020 | $851 | $22,180 | $5,850 | $16,330 |
| 2019 | $848 | $22,180 | $5,850 | $16,330 |
| 2018 | $766 | $19,760 | $3,430 | $16,330 |
| 2017 | $966 | $25,100 | $4,570 | $20,530 |
| 2016 | $906 | $25,100 | $4,570 | $20,530 |
| 2015 | $646 | $17,150 | $4,660 | $12,490 |
| 2014 | $623 | $17,150 | $4,660 | $12,490 |
| 2013 | $535 | $14,770 | $4,660 | $10,110 |
Source: Public Records
Map
Nearby Homes
- 303 Pike St
- 321 Wyanoke St
- 222 Saint Charles St
- 2805 S 8th St
- 105 Compliment St
- 805 1/2 High St
- 514 Lane St
- 613 Latonia St
- 2614 S 5th St
- 519 Lane St
- 1100 Price St
- 2518 S 9th St
- 115 Patton Dr
- 2444 S 10th St
- 212 Bellefonte Princess Rd
- 1110 Vine St
- 107 Patton Dr
- 298 Bellefonte Princess Rd
- 216 Lycan Ct
- 1336 High St W
- 3611 S 3rd St
- 3623 S 3rd St
- 3629 S 3rd St
- 3637 S 3rd St
- 3608 S 3rd St
- 3643 S 3rd St Unit COMO-4
- 3643 S 3rd St
- 3643 S 3rd St Unit COMO-1
- 3706 S 3rd St
- 3717 S 3rd St
- 3724 S 3rd St
- 3724 S 3rd St
- 3711 S 3rd St
- 129 County Road 24
- 205 Marion Pike
- 101 Marion Pike
- 3215 S 3rd St Unit COMO-1
- 3215 S 3rd St
- 115 Pike St
- 3129 S 3rd St Unit ST
Your Personal Tour Guide
Ask me questions while you tour the home.