3683 Jones Rd Macon, GA 31216
Estimated Value: $214,002 - $289,000
About This Home
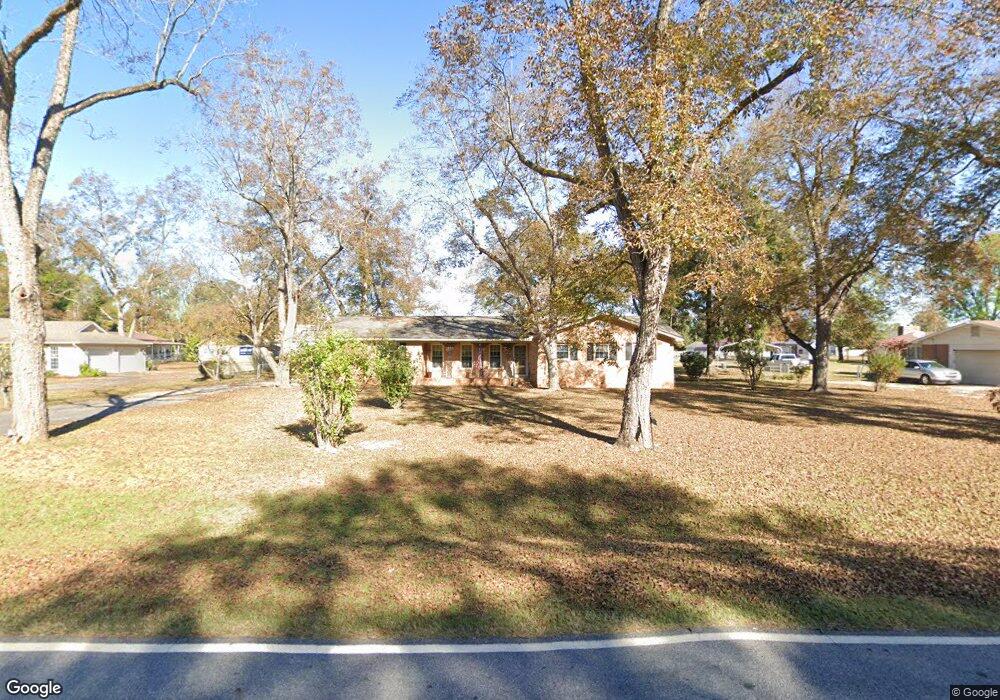
This home is located at 3683 Jones Rd, Macon, GA 31216 and is currently estimated at $245,501, approximately $133 per square foot. 3683 Jones Rd is a home located in Bibb County with nearby schools including Porter Elementary School, Rutland Middle School, and Rutland High School.
Ownership History
We collect this data history from publicly available records. To have your information removed, we recommend requesting removal directly through your county’s website.
Purchase Details
Home Financials for this Owner
Home Financials are based on the most recent Mortgage that was taken out on this home.Purchase Details
Purchase History
We collect this data history from publicly available records. To have your information removed, we recommend requesting removal directly through your county’s website.
| Date | Buyer | Sale Price | Title Company |
|---|---|---|---|
| $125,000 | -- | ||
| $85,000 | -- |
Mortgage History
We collect this data history from publicly available records. To have your information removed, we recommend requesting removal directly through your county’s website.
| Date | Status | Borrower | Loan Amount |
|---|---|---|---|
| Open | $125,000 |
Tax History
We collect this data history from publicly available records. To have your information removed, we recommend requesting removal directly through your county’s website.
| Year | Tax Paid | Tax Assessment Tax Assessment Total Assessment is a certain percentage of the fair market value that is determined by local assessors to be the total taxable value of land and additions on the property. | Land | Improvement |
|---|---|---|---|---|
| 2025 | $1,515 | $68,640 | $14,000 | $54,640 |
| 2024 | $1,561 | $68,467 | $14,000 | $54,467 |
| 2023 | $864 | $59,004 | $14,000 | $45,004 |
| 2022 | $1,356 | $46,155 | $5,184 | $40,971 |
| 2021 | $1,488 | $46,155 | $5,184 | $40,971 |
| 2020 | $1,354 | $49,611 | $8,640 | $40,971 |
| 2019 | $1,548 | $46,550 | $7,680 | $38,870 |
| 2018 | $2,865 | $44,780 | $7,680 | $37,100 |
| 2017 | $1,625 | $43,371 | $8,040 | $35,331 |
| 2016 | $1,258 | $43,372 | $8,040 | $35,331 |
| 2015 | $1,522 | $38,064 | $8,040 | $30,023 |
| 2014 | $489 | $36,901 | $8,040 | $28,860 |
Map
- 3708 Jones Rd
- 189 Stonefield Cir
- 308 Ellis Ct
- 3491 Sandy Cir
- 6266 Houston Rd
- 142 Golden Ocala Blvd
- 405 Stonecrest Ct
- 3710 Sandy Cir
- 6045 Cara Dr
- 813 Ocala National Trail
- 5625 Whippoorwill Dr
- 3150 Holleman Dr
- 5910 Houston Rd
- 360 Golden Ocala Blvd
- 3294 Bridgewood Dr
- 3290 Bridgewood Dr
- 1119 Alma Dr
- 3533 Bridgewood Dr
- 3720 Western Way
- 3906 Hartley Bridge Rd
- 3688 Dean Dr
- 3692 Dean Dr
- 3684 Dean Dr
- 151 Stonefield Cir
- 3673 Jones Rd
- 3696 Dean Dr
- 3691 Dean Dr Unit 61
- 3691 Dean Dr
- 155 Stonefield Cir
- 3685 Dean Dr
- 3663 Jones Rd
- 3693 Jones Rd
- 3697 Dean Dr
- 148 Stonefield Cir
- 3700 Dean Dr
- 146 Stonefield Cir
- 159 Stonefield Cir
- 152 Stonefield Cir
- 139 Stonefield Cir
- 3703 Jones Rd
Ask me questions while you tour the home.