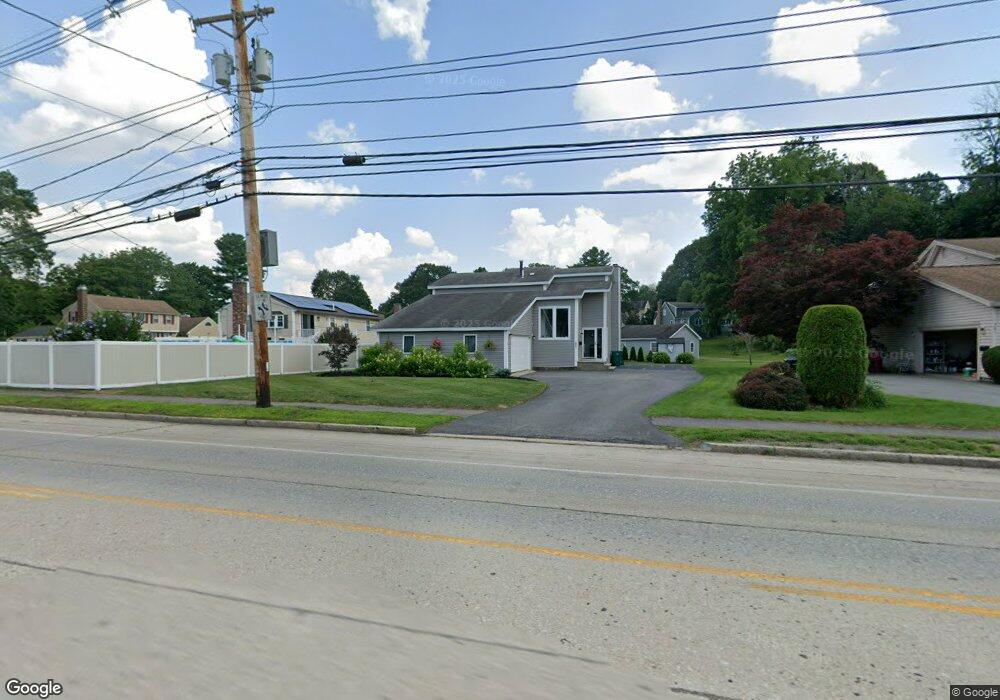
369 Andover St Lowell, MA 01852
Belvidere NeighborhoodEstimated Value: $699,000 - $764,154
About This Home
This home is located at 369 Andover St, Lowell, MA 01852 and is currently estimated at $730,289, approximately $307 per square foot. 369 Andover St is a home located in Middlesex County with nearby schools including Moody Elementary School, Abraham Lincoln Elementary School, and Greenhalge Elementary School.
Ownership History
We collect this data history from publicly available records. To have your information removed, we recommend requesting removal directly through your county’s website.
Purchase Details
Home Financials for this Owner
Home Financials are based on the most recent Mortgage that was taken out on this home.Purchase Details
Home Financials for this Owner
Home Financials are based on the most recent Mortgage that was taken out on this home.Purchase Details
Home Values in the Area
Average Home Value in this Area
Purchase History
We collect this data history from publicly available records. To have your information removed, we recommend requesting removal directly through your county’s website.
| Date | Buyer | Sale Price | Title Company |
|---|---|---|---|
| $337,000 | -- | ||
| -- | -- | ||
| -- | -- | ||
| -- | -- | ||
| $228,000 | -- |
Mortgage History
We collect this data history from publicly available records. To have your information removed, we recommend requesting removal directly through your county’s website.
| Date | Status | Borrower | Loan Amount |
|---|---|---|---|
| Closed | $330,891 | ||
| Previous Owner | $185,000 |
Tax History
We collect this data history from publicly available records. To have your information removed, we recommend requesting removal directly through your county’s website.
| Year | Tax Paid | Tax Assessment Tax Assessment Total Assessment is a certain percentage of the fair market value that is determined by local assessors to be the total taxable value of land and additions on the property. | Land | Improvement |
|---|---|---|---|---|
| 2025 | $7,759 | $675,900 | $241,400 | $434,500 |
| 2024 | $7,515 | $631,000 | $225,600 | $405,400 |
| 2023 | $7,315 | $589,000 | $196,200 | $392,800 |
| 2022 | $6,952 | $547,800 | $178,300 | $369,500 |
| 2021 | $6,367 | $473,000 | $155,100 | $317,900 |
| 2020 | $6,168 | $461,700 | $155,100 | $306,600 |
| 2019 | $6,380 | $454,400 | $154,300 | $300,100 |
| 2018 | $6,363 | $442,200 | $146,900 | $295,300 |
| 2017 | $6,083 | $407,700 | $136,300 | $271,400 |
| 2016 | $5,943 | $392,000 | $125,400 | $266,600 |
| 2015 | $5,498 | $355,200 | $125,400 | $229,800 |
| 2013 | $4,877 | $324,900 | $138,400 | $186,500 |
Map
- 305 Andover St
- 54 Wentworth Ave
- 21 Guild St
- 36 Plummer Ave
- 333 First Street Blvd Unit 209
- 36 Glenn Rd
- 62 Huntington St
- 223 Stackpole St
- 35 Oak St
- 116 Fort Hill Ave
- 18 Nob Way
- 588 Andover St
- 112 Durant St
- 318 High St
- 52 Christian St
- 70 Pleasant St
- 18 Pleasant St
- 158 Concord St
- 82 Christian St
- 176 Pleasant St
Ask me questions while you tour the home.