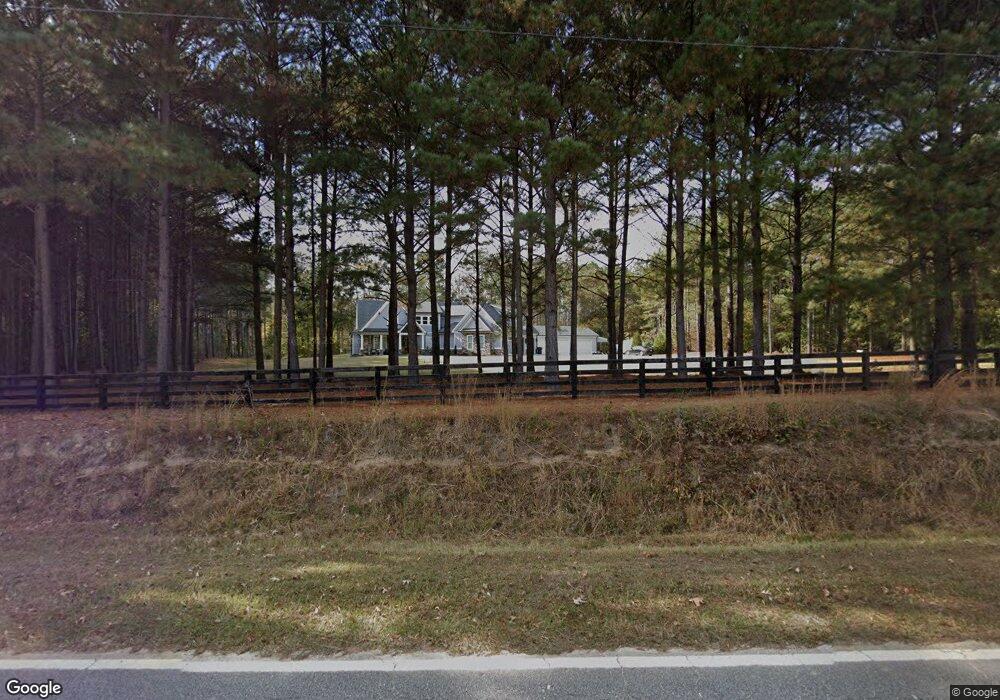
369 Poplar Dr Brooks, GA 30205
Spalding County NeighborhoodEstimated Value: $362,000 - $944,640
2
Beds
1
Bath
1,006
Sq Ft
$649/Sq Ft
Est. Value
About This Home
This home is located at 369 Poplar Dr, Brooks, GA 30205 and is currently estimated at $653,320, approximately $649 per square foot. 369 Poplar Dr is a home located in Spalding County with nearby schools including Moreland Road Elementary School, Carver Road Middle School, and Griffin High School.
Ownership History
Date
Name
Owned For
Owner Type
Purchase Details
Closed on
Nov 30, 2016
Sold by
Total Shipping Solutions Llc
Bought by
Parks Brandon
Current Estimated Value
Purchase Details
Closed on
Sep 1, 2016
Sold by
Total Shipping Solutions Llc
Bought by
Matlock Gary S and Matlock Deanna C
Purchase Details
Closed on
Oct 21, 2015
Sold by
The Bank Of New York Trustee
Bought by
Total Shipping Solutions Llc
Purchase Details
Closed on
Sep 4, 2012
Sold by
Cain Everett
Bought by
The Bank Of New York Trustee
Purchase Details
Closed on
Nov 5, 2011
Sold by
Cain Everett J
Bought by
Cain Mark O
Purchase Details
Closed on
Aug 6, 2004
Sold by
Ison Marshall E and Ison Mildred
Bought by
Cain Everett J
Home Financials for this Owner
Home Financials are based on the most recent Mortgage that was taken out on this home.
Original Mortgage
$179,900
Interest Rate
4%
Mortgage Type
New Conventional
Purchase Details
Closed on
May 24, 1966
Sold by
Ison Addie Maie
Bought by
Ison William G
Create a Home Valuation Report for This Property
The Home Valuation Report is an in-depth analysis detailing your home's value as well as a comparison with similar homes in the area
Home Values in the Area
Average Home Value in this Area
Purchase History
| Date | Buyer | Sale Price | Title Company |
|---|---|---|---|
| Parks Brandon | $25,000 | -- | |
| Matlock Gary S | $83,000 | -- | |
| Total Shipping Solutions Llc | $30,000 | -- | |
| The Bank Of New York Trustee | -- | -- | |
| Cain Mark O | -- | -- | |
| Cain Everett J | $199,900 | -- | |
| Ison William G | -- | -- |
Source: Public Records
Mortgage History
| Date | Status | Borrower | Loan Amount |
|---|---|---|---|
| Previous Owner | Cain Everett J | $179,900 |
Source: Public Records
Tax History
| Year | Tax Paid | Tax Assessment Tax Assessment Total Assessment is a certain percentage of the fair market value that is determined by local assessors to be the total taxable value of land and additions on the property. | Land | Improvement |
|---|---|---|---|---|
| 2025 | $11,484 | $322,832 | $52,088 | $270,744 |
| 2024 | $11,359 | $296,271 | $52,088 | $244,183 |
| 2023 | $10,534 | $296,271 | $52,088 | $244,183 |
| 2022 | $7,674 | $250,412 | $29,516 | $220,896 |
| 2021 | $7,199 | $199,803 | $29,516 | $170,287 |
| 2020 | $7,225 | $199,803 | $29,516 | $170,287 |
| 2019 | $1,610 | $43,255 | $23,613 | $19,642 |
| 2018 | $0 | $37,912 | $23,613 | $14,299 |
| 2017 | $1,234 | $37,912 | $23,613 | $14,299 |
| 2016 | $454 | $49,827 | $35,528 | $14,299 |
| 2015 | $1,942 | $49,827 | $35,528 | $14,299 |
| 2014 | $1,981 | $49,827 | $35,528 | $14,299 |
Source: Public Records
Map
Nearby Homes
- 6475 Newnan Rd
- 161 Mockingbird Ln
- 210 Mockingbird Ln
- 460 Mask Rd
- LOT 7 Mask Road - Hanner's Farm S
- LOT 8 Mask Road - Hanner's Farm S
- LOT 5 Mask Road - Hanner's Farm N
- LOT 6 Mask Road - Hanner's Farm N
- LOT 4 Mask Road - Hanner's Farm N
- LOT 3 Mask Road - Hanner's Farm N
- 0 Mask Rd Unit 10671477
- 130 Brooklet Way
- 9902 Highway 16
- 4101 W Ellis Rd
- 3 ACRES Anderson Rd
- 395 W Mcintosh Rd
- 0 W Mcintosh Rd Unit 10654779
- NEXT TO 443 W Mcintosh Rd
- 105 Crabtree Rd
- 325 Camp Ground Rd
- 344 Poplar Dr
- 400 Poplar Dr
- 400 Poplar Dr Unit 7+/-
- 280 Poplar Dr
- 624 Lakeview Dr
- 618 Lakeview Dr
- 482 Poplar Dr
- 621 Lakeview Dr
- 680 Lakeview Dr
- 488 Poplar Dr
- 615 Lakeview Dr
- 343 Clayton Rd
- 513 Poplar Dr
- 255 Clayton Rd
- 553 Poplar Dr Unit A
- 553 Poplar Dr
- 251 Poplar Dr
- 262 Poplar Dr
- 550 Poplar Dr
- 525 Lakeview Dr
Your Personal Tour Guide
Ask me questions while you tour the home.