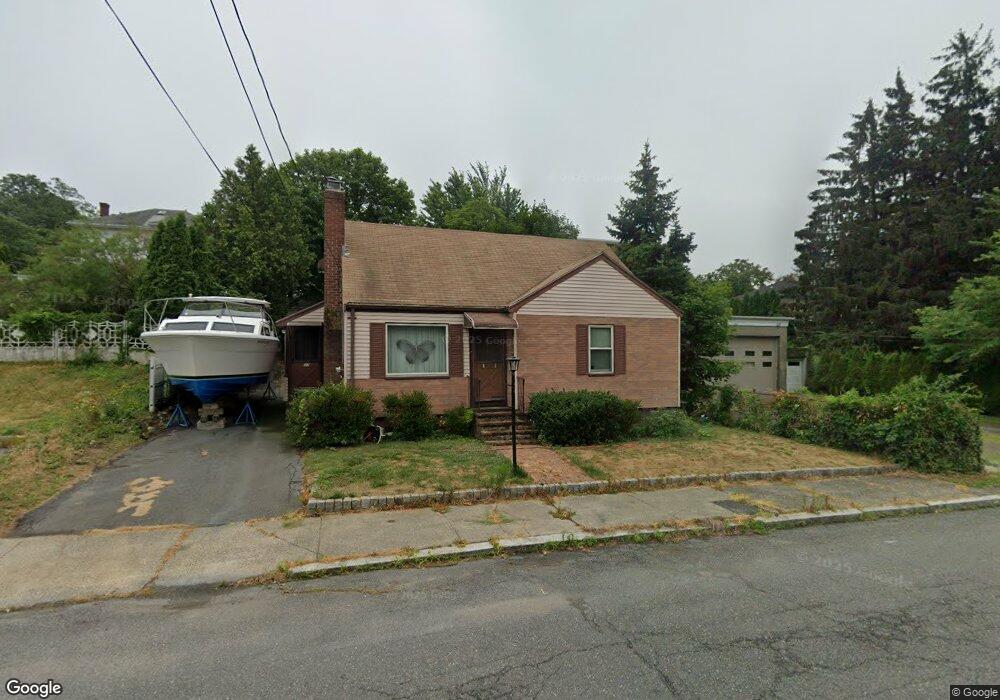
37 Charles St Salem, MA 01970
South Salem NeighborhoodEstimated Value: $517,812 - $619,000
2
Beds
1
Bath
1,058
Sq Ft
$544/Sq Ft
Est. Value
About This Home
This home is located at 37 Charles St, Salem, MA 01970 and is currently estimated at $575,203, approximately $543 per square foot. 37 Charles St is a home located in Essex County with nearby schools including Saltonstall School, Horace Mann Laboratory, and Carlton Elementary School.
Ownership History
Date
Name
Owned For
Owner Type
Purchase Details
Closed on
Jul 17, 2009
Sold by
Zalewski Joseph P
Bought by
Zalewski Joseph P
Current Estimated Value
Create a Home Valuation Report for This Property
The Home Valuation Report is an in-depth analysis detailing your home's value as well as a comparison with similar homes in the area
Home Values in the Area
Average Home Value in this Area
Purchase History
We collect this data history from publicly available records. To have your information removed, we recommend requesting removal directly through your county’s website.
| Date | Buyer | Sale Price | Title Company |
|---|---|---|---|
| Zalewski Joseph P | -- | -- |
Source: Public Records
Mortgage History
We collect this data history from publicly available records. To have your information removed, we recommend requesting removal directly through your county’s website.
| Date | Status | Borrower | Loan Amount |
|---|---|---|---|
| Previous Owner | Zalewski Joseph P | $35,000 | |
| Previous Owner | Zalewski Joseph P | $50,000 | |
| Previous Owner | Zalewski Joseph P | $41,500 |
Source: Public Records
Tax History
| Year | Tax Paid | Tax Assessment Tax Assessment Total Assessment is a certain percentage of the fair market value that is determined by local assessors to be the total taxable value of land and additions on the property. | Land | Improvement |
|---|---|---|---|---|
| 2025 | $5,375 | $474,000 | $203,400 | $270,600 |
| 2024 | $5,257 | $452,400 | $193,300 | $259,100 |
| 2023 | $5,060 | $404,500 | $178,400 | $226,100 |
| 2022 | $5,072 | $382,800 | $172,400 | $210,400 |
| 2021 | $4,742 | $343,600 | $160,500 | $183,100 |
| 2020 | $4,777 | $330,600 | $151,600 | $179,000 |
| 2019 | $4,750 | $314,600 | $143,900 | $170,700 |
| 2018 | $4,546 | $295,600 | $136,800 | $158,800 |
| 2017 | $4,217 | $265,900 | $115,400 | $150,500 |
| 2016 | $4,082 | $260,500 | $110,000 | $150,500 |
| 2015 | $3,956 | $241,100 | $101,100 | $140,000 |
Source: Public Records
Map
Nearby Homes
- 80 Linden St Unit 80
- 3 Wisteria St Unit 2
- 6 Linden St Unit 2
- 16 Cloutman St Unit 2
- 3 Preston Rd Unit 1
- 245 Lafayette St Unit 3G
- 6R Hazel Terrace Unit 1
- 10 Geneva St Unit 10
- 23 Marion Rd Unit B
- 10 Saltonstall Pkwy Unit 2
- 5 Gardner St Unit 3
- 1 Griswold Dr Unit 11A
- 184 Lafayette St
- 185 Lafayette St Unit 3
- 17 Palmer St
- 154 Lafayette St Unit 2
- 1-7 Prince St & 48-54 Harbor St
- 41 Endicott St Unit 41
- 75 Summer St Unit 5
- 18 Phelps St Unit 1
- 18 Charles St
- 12 Charles St Unit 3
- 22 Charles St
- 10 Charles St
- 26 Charles St
- 8 Charles St
- 8 - 8 1/2 Charles St
- 23 Charles St
- 9 Day Ave
- 6 Charles St Unit 2
- 6 Charles St Unit 1
- 6 Charles St
- 25 Charles St
- 7 Day Ave
- 7 Charles St
- 16 Loring Ave Unit 4
- 16 Loring Ave Unit 3
- 16 Loring Ave Unit 1
- 18 Loring Ave Unit 3
- 18 Loring Ave Unit AVENEUE
Your Personal Tour Guide
Ask me questions while you tour the home.