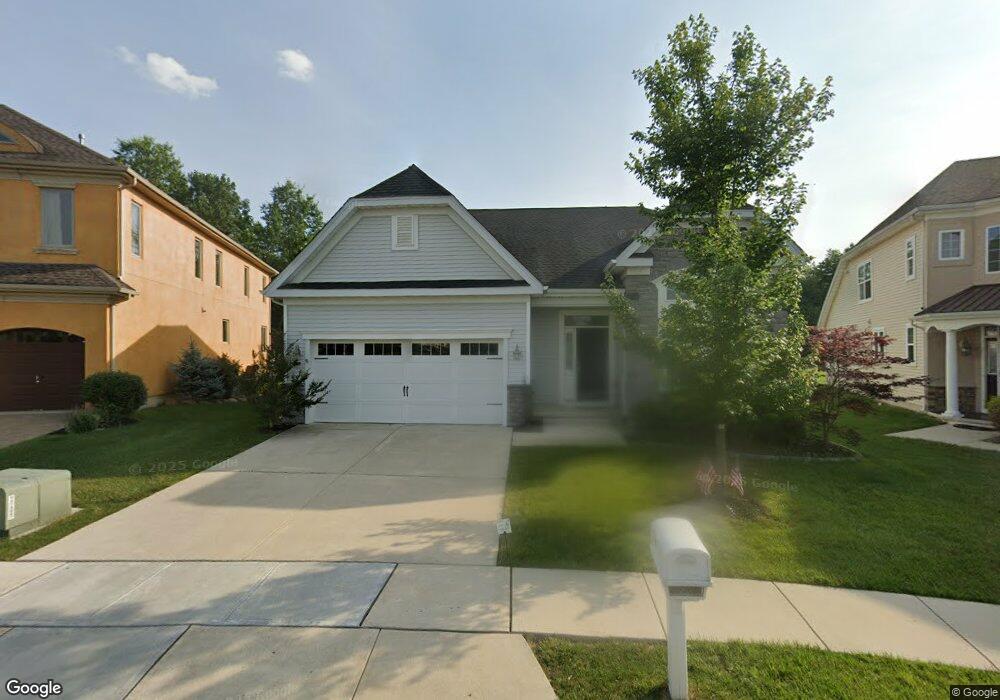
37 Davinci Dr Monmouth Junction, NJ 08852
Estimated Value: $765,406 - $874,000
Studio
--
Bath
2,620
Sq Ft
$314/Sq Ft
Est. Value
About This Home
This home is located at 37 Davinci Dr, Monmouth Junction, NJ 08852 and is currently estimated at $823,852, approximately $314 per square foot. 37 Davinci Dr is a home with nearby schools including Monmouth Junction Elementary School, Crossroads North Middle School, and South Brunswick High School.
Ownership History
Date
Name
Owned For
Owner Type
Purchase Details
Closed on
Nov 12, 2018
Sold by
U S Home Corporation
Bought by
Awwal Mohammad Abdul and Awwal Afroz
Current Estimated Value
Purchase Details
Closed on
Dec 9, 2016
Sold by
U S Home Corp
Bought by
Frasch Russell J and Frasch Margaret E
Home Financials for this Owner
Home Financials are based on the most recent Mortgage that was taken out on this home.
Original Mortgage
$445,939
Interest Rate
3.47%
Mortgage Type
New Conventional
Create a Home Valuation Report for This Property
The Home Valuation Report is an in-depth analysis detailing your home's value as well as a comparison with similar homes in the area
Home Values in the Area
Average Home Value in this Area
Purchase History
| Date | Buyer | Sale Price | Title Company |
|---|---|---|---|
| Awwal Mohammad Abdul | $610,720 | Golden Title Agency Llc | |
| Frasch Russell J | $469,410 | North American Title Agency |
Source: Public Records
Mortgage History
| Date | Status | Borrower | Loan Amount |
|---|---|---|---|
| Previous Owner | Frasch Russell J | $445,939 |
Source: Public Records
Tax History
| Year | Tax Paid | Tax Assessment Tax Assessment Total Assessment is a certain percentage of the fair market value that is determined by local assessors to be the total taxable value of land and additions on the property. | Land | Improvement |
|---|---|---|---|---|
| 2025 | $12,868 | $239,600 | $70,000 | $169,600 |
| 2024 | $12,405 | $238,200 | $70,000 | $168,200 |
| 2023 | $12,405 | $238,200 | $70,000 | $168,200 |
| 2022 | $12,036 | $238,200 | $70,000 | $168,200 |
| 2021 | $11,989 | $238,200 | $70,000 | $168,200 |
| 2020 | $12,110 | $238,200 | $70,000 | $168,200 |
| 2019 | $12,220 | $238,200 | $70,000 | $168,200 |
| 2018 | $11,819 | $238,200 | $70,000 | $168,200 |
| 2017 | $1,734 | $35,000 | $35,000 | $0 |
| 2016 | $1,716 | $35,000 | $35,000 | $0 |
| 2015 | $1,664 | $35,000 | $35,000 | $0 |
| 2014 | $1,169 | $25,000 | $25,000 | $0 |
Source: Public Records
Map
Nearby Homes
- 26 Davinci Dr
- 6 Michelangelo Dr
- 19 Davinci Dr
- 505 Pheasant Run Unit 11B
- 304 Heskers Ct Unit 304
- 784 Ridge Rd
- 14 Wexford Dr
- 36 Lavender Dr
- 15 Arbutus Way
- 4 Donner Ct
- 6 Stafford Rd
- 101 Baker St
- 23 Douglass Dr
- 302 Wellington Park Dr
- 103 Creststone Cir
- 3293 Cypress Ct
- 4 Bernadette Cir
- 3373 Cypress Ct
- 53 Kelly Way
- 76 Coriander Dr
Your Personal Tour Guide
Ask me questions while you tour the home.