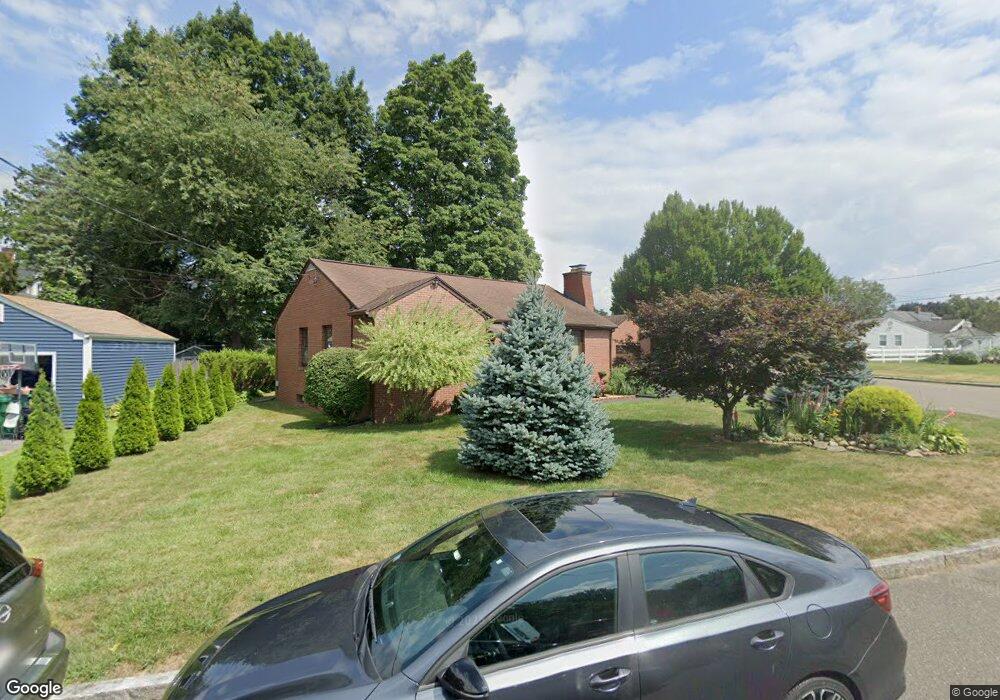
37 Hafey St Chicopee, MA 01013
Chicopee Center NeighborhoodEstimated Value: $285,441 - $321,000
2
Beds
2
Baths
1,257
Sq Ft
$241/Sq Ft
Est. Value
About This Home
This home is located at 37 Hafey St, Chicopee, MA 01013 and is currently estimated at $302,610, approximately $240 per square foot. 37 Hafey St is a home located in Hampden County with nearby schools including Bowe Elementary School, Fairview Middle School, and Chicopee High School.
Ownership History
Date
Name
Owned For
Owner Type
Purchase Details
Closed on
Dec 20, 2024
Sold by
Gryz Andrzej J
Bought by
Gryz Bernarda M
Current Estimated Value
Purchase Details
Closed on
Jan 13, 2011
Sold by
Desrosiers Carol H and May Kathleen M
Bought by
Gryz Andrzej J and Gryz Bernarda M
Home Financials for this Owner
Home Financials are based on the most recent Mortgage that was taken out on this home.
Original Mortgage
$124,000
Interest Rate
4.46%
Mortgage Type
Purchase Money Mortgage
Create a Home Valuation Report for This Property
The Home Valuation Report is an in-depth analysis detailing your home's value as well as a comparison with similar homes in the area
Home Values in the Area
Average Home Value in this Area
Purchase History
We collect this data history from publicly available records. To have your information removed, we recommend requesting removal directly through your county’s website.
| Date | Buyer | Sale Price | Title Company |
|---|---|---|---|
| Gryz Bernarda M | $40,000 | None Available | |
| Gryz Bernarda M | $40,000 | None Available | |
| Gryz Andrzej J | $155,000 | -- | |
| Gryz Andrzej J | $155,000 | -- | |
| Gryz Andrzej J | $155,000 | -- |
Source: Public Records
Mortgage History
We collect this data history from publicly available records. To have your information removed, we recommend requesting removal directly through your county’s website.
| Date | Status | Borrower | Loan Amount |
|---|---|---|---|
| Previous Owner | Gryz Andrzej J | $124,000 |
Source: Public Records
Tax History
| Year | Tax Paid | Tax Assessment Tax Assessment Total Assessment is a certain percentage of the fair market value that is determined by local assessors to be the total taxable value of land and additions on the property. | Land | Improvement |
|---|---|---|---|---|
| 2025 | $3,688 | $243,300 | $86,800 | $156,500 |
| 2024 | $3,569 | $241,800 | $85,100 | $156,700 |
| 2023 | $3,309 | $218,400 | $77,400 | $141,000 |
| 2022 | $3,147 | $185,200 | $67,300 | $117,900 |
| 2021 | $3,067 | $172,800 | $61,200 | $111,600 |
| 2020 | $2,876 | $164,700 | $61,200 | $103,500 |
| 2019 | $2,823 | $157,200 | $61,200 | $96,000 |
| 2018 | $2,927 | $150,600 | $58,300 | $92,300 |
| 2017 | $2,532 | $146,300 | $58,300 | $88,000 |
| 2016 | $2,381 | $140,800 | $58,300 | $82,500 |
| 2015 | $2,673 | $152,400 | $58,300 | $94,100 |
| 2014 | $1,337 | $152,400 | $58,300 | $94,100 |
Source: Public Records
Map
Nearby Homes
- 44 White St
- 2 Marion St
- 157 Sunnymeade Ave
- 35 Lower Grape St
- 156 South St
- 85 Farnsworth St
- 582 Broadway St
- 177 Marion St
- 18 Los Angeles St
- 36 Parkin St
- 0 School St
- 827-831 Armory St
- 28 Clairmont Ave
- 70 Norman St
- 151 Edgewood Ave
- 22 Felicia St
- 221 East St
- 127 Governor St
- 78 Governor St
- 51 E Canton Cir
Your Personal Tour Guide
Ask me questions while you tour the home.