37 John St Marshfield, MA 02050
Marshfield AreaEstimated Value: $872,438 - $966,000
About This Home
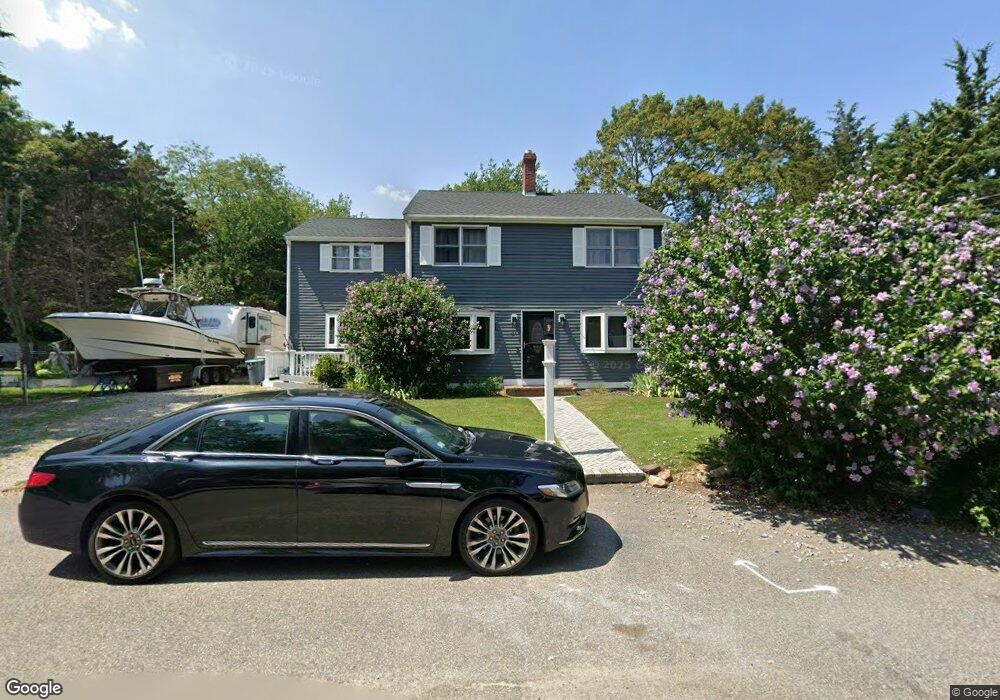
This home is located at 37 John St, Marshfield, MA 02050 and is currently estimated at $927,860, approximately $369 per square foot. 37 John St is a home located in Plymouth County with nearby schools including Daniel Webster, Furnace Brook Middle School, and Marshfield High School.
Ownership History
We collect this data history from publicly available records. To have your information removed, we recommend requesting removal directly through your county’s website.
Purchase Details
Home Values in the Area
Average Home Value in this Area
Purchase History
We collect this data history from publicly available records. To have your information removed, we recommend requesting removal directly through your county’s website.
| Date | Buyer | Sale Price | Title Company |
|---|---|---|---|
| $37,188 | -- |
Mortgage History
We collect this data history from publicly available records. To have your information removed, we recommend requesting removal directly through your county’s website.
| Date | Status | Borrower | Loan Amount |
|---|---|---|---|
| Open | $102,000 | ||
| Closed | $31,000 | ||
| Closed | $105,000 | ||
| Closed | $75,000 |
Tax History
We collect this data history from publicly available records. To have your information removed, we recommend requesting removal directly through your county’s website.
| Year | Tax Paid | Tax Assessment Tax Assessment Total Assessment is a certain percentage of the fair market value that is determined by local assessors to be the total taxable value of land and additions on the property. | Land | Improvement |
|---|---|---|---|---|
| 2025 | $7,500 | $757,600 | $295,500 | $462,100 |
| 2024 | $7,306 | $703,200 | $281,400 | $421,800 |
| 2023 | $6,800 | $617,900 | $251,300 | $366,600 |
| 2022 | $6,800 | $525,100 | $211,100 | $314,000 |
| 2021 | $6,595 | $500,000 | $211,100 | $288,900 |
| 2020 | $6,313 | $473,600 | $191,000 | $282,600 |
| 2019 | $6,168 | $461,000 | $191,000 | $270,000 |
| 2018 | $6,107 | $456,800 | $191,000 | $265,800 |
| 2017 | $5,953 | $433,900 | $191,000 | $242,900 |
| 2016 | $5,848 | $421,300 | $191,000 | $230,300 |
| 2015 | $5,329 | $401,000 | $191,000 | $210,000 |
| 2014 | $5,244 | $394,600 | $191,000 | $203,600 |
Map
- 6 Gratto Rd
- 18 Liberty Rd
- 47 Old Colony Ln Unit 127
- 19 Copeland St
- 43 Chandler Dr
- 1080 Ocean St
- 155 Quincy Ave
- 1028 Ocean St
- 6 Country Way
- 1 Carpenter Ln
- 1801 Ocean St Unit B21
- 41 Constantine Dr
- 766 Ocean St
- 75 Norwell Rd
- 170 Meadowview St
- 46 Fairways Edge Dr
- 8 Duxbury St
- 8 Duxbury St
- 713 Webster St
- 670 Webster St
Ask me questions while you tour the home.