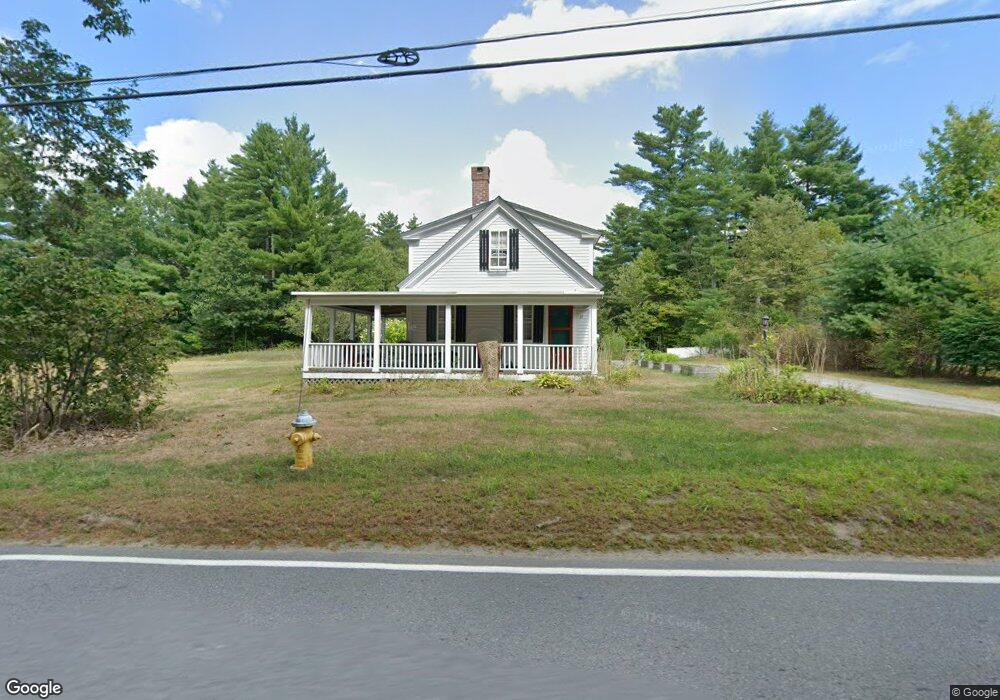
37 Mason Rd West Townsend, MA 01474
Estimated Value: $464,784 - $473,000
3
Beds
2
Baths
1,808
Sq Ft
$260/Sq Ft
Est. Value
About This Home
This home is located at 37 Mason Rd, West Townsend, MA 01474 and is currently estimated at $470,696, approximately $260 per square foot. 37 Mason Rd is a home located in Middlesex County with nearby schools including North Middlesex Regional High School.
Ownership History
Date
Name
Owned For
Owner Type
Purchase Details
Closed on
Feb 1, 1993
Sold by
Est Bailey Helen E and Hill John R
Bought by
Caterino Kevin F and Caterino June M
Current Estimated Value
Home Financials for this Owner
Home Financials are based on the most recent Mortgage that was taken out on this home.
Original Mortgage
$58,000
Interest Rate
8.16%
Mortgage Type
Purchase Money Mortgage
Create a Home Valuation Report for This Property
The Home Valuation Report is an in-depth analysis detailing your home's value as well as a comparison with similar homes in the area
Home Values in the Area
Average Home Value in this Area
Purchase History
We collect this data history from publicly available records. To have your information removed, we recommend requesting removal directly through your county’s website.
| Date | Buyer | Sale Price | Title Company |
|---|---|---|---|
| Caterino Kevin F | $80,000 | -- |
Source: Public Records
Mortgage History
We collect this data history from publicly available records. To have your information removed, we recommend requesting removal directly through your county’s website.
| Date | Status | Borrower | Loan Amount |
|---|---|---|---|
| Open | Caterino Kevin F | $74,000 | |
| Closed | Caterino Kevin F | $7,000 | |
| Closed | Caterino Kevin F | $58,000 |
Source: Public Records
Tax History
| Year | Tax Paid | Tax Assessment Tax Assessment Total Assessment is a certain percentage of the fair market value that is determined by local assessors to be the total taxable value of land and additions on the property. | Land | Improvement |
|---|---|---|---|---|
| 2025 | $5,458 | $375,900 | $114,900 | $261,000 |
| 2024 | $5,296 | $367,500 | $114,900 | $252,600 |
| 2023 | $4,969 | $325,600 | $101,900 | $223,700 |
| 2022 | $4,941 | $280,600 | $86,400 | $194,200 |
| 2021 | $4,832 | $263,600 | $87,700 | $175,900 |
| 2020 | $4,585 | $234,900 | $74,400 | $160,500 |
| 2019 | $4,541 | $234,900 | $74,400 | $160,500 |
| 2018 | $4,244 | $209,500 | $71,600 | $137,900 |
| 2017 | $3,960 | $201,300 | $72,500 | $128,800 |
| 2016 | $3,841 | $194,000 | $72,500 | $121,500 |
| 2015 | $3,788 | $198,200 | $79,500 | $118,700 |
| 2014 | $3,934 | $201,000 | $77,200 | $123,800 |
Source: Public Records
Map
Nearby Homes
- 17 New Fitchburg Rd
- 83 Mason Rd
- 87 Turnpike Rd
- 53 W Meadow Rd
- 2 W Meadow Rd
- 549 Main St
- 213 Mason Rd
- 5 Turnpike Rd Unit 226
- 1203 Townsend Rd
- 1 Depot Street Extension Unit 1
- 1 Depot Street Extension Unit 4
- 1 Depot Street Extension Unit 5
- 41 Brookline St
- 87A Brookline St
- 00 Juniper Hill
- 731 Foster Rd
- 0 Brookline St
- 0 Davis Rd
- 64 Meadow Rd
- 522 Greenville Rd
Your Personal Tour Guide
Ask me questions while you tour the home.