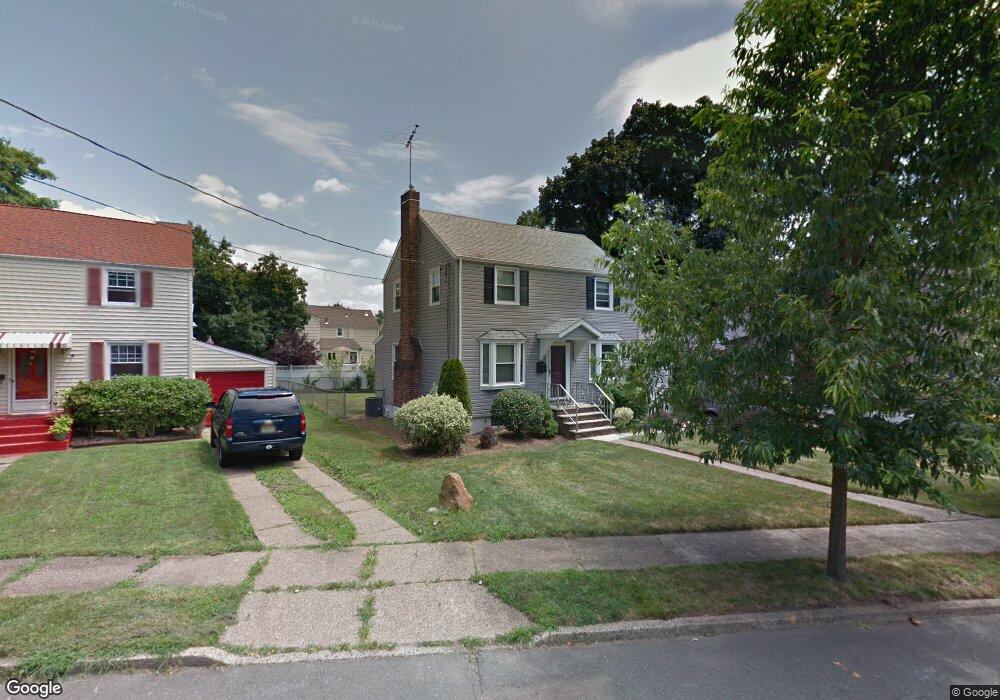
37 Phillips St Bloomfield, NJ 07003
Estimated Value: $620,000 - $776,000
Studio
--
Bath
1,488
Sq Ft
$456/Sq Ft
Est. Value
About This Home
This home is located at 37 Phillips St, Bloomfield, NJ 07003 and is currently estimated at $677,955, approximately $455 per square foot. 37 Phillips St is a home located in Essex County with nearby schools including Demarest School, Bloomfield Middle School, and Bloomfield High School.
Ownership History
Date
Name
Owned For
Owner Type
Purchase Details
Closed on
Sep 17, 2020
Sold by
Lacatena Natalie
Bought by
Vulin Tanja and Smith Samantha
Current Estimated Value
Home Financials for this Owner
Home Financials are based on the most recent Mortgage that was taken out on this home.
Original Mortgage
$434,976
Outstanding Balance
$386,012
Interest Rate
2.9%
Mortgage Type
FHA
Estimated Equity
$291,943
Purchase Details
Closed on
Sep 13, 1999
Sold by
Wildt Lillian
Bought by
Lacatena Natalie
Home Financials for this Owner
Home Financials are based on the most recent Mortgage that was taken out on this home.
Original Mortgage
$140,000
Interest Rate
7.85%
Create a Home Valuation Report for This Property
The Home Valuation Report is an in-depth analysis detailing your home's value as well as a comparison with similar homes in the area
Home Values in the Area
Average Home Value in this Area
Purchase History
| Date | Buyer | Sale Price | Title Company |
|---|---|---|---|
| Vulin Tanja | $443,000 | Ridge Title Agency Llc | |
| Lacatena Natalie | $160,000 | -- |
Source: Public Records
Mortgage History
| Date | Status | Borrower | Loan Amount |
|---|---|---|---|
| Open | Vulin Tanja | $434,976 | |
| Previous Owner | Lacatena Natalie | $140,000 |
Source: Public Records
Tax History
| Year | Tax Paid | Tax Assessment Tax Assessment Total Assessment is a certain percentage of the fair market value that is determined by local assessors to be the total taxable value of land and additions on the property. | Land | Improvement |
|---|---|---|---|---|
| 2025 | $13,493 | $397,800 | $161,100 | $236,700 |
| 2024 | $13,000 | $397,800 | $161,100 | $236,700 |
| 2022 | $12,738 | $397,800 | $161,100 | $236,700 |
| 2021 | $12,503 | $397,800 | $161,100 | $236,700 |
| 2020 | $12,312 | $397,800 | $161,100 | $236,700 |
| 2019 | $12,015 | $301,800 | $144,000 | $157,800 |
| 2018 | $11,963 | $301,800 | $144,000 | $157,800 |
| 2017 | $11,782 | $301,800 | $144,000 | $157,800 |
| 2016 | $11,649 | $301,800 | $144,000 | $157,800 |
| 2015 | $11,544 | $301,800 | $144,000 | $157,800 |
| 2014 | $11,333 | $301,800 | $144,000 | $157,800 |
Source: Public Records
Map
Nearby Homes
- 1116 Broad St
- 95 Mohr Ave
- 51 Albert Terrace
- 17 Brookdale Rd
- 935 Broad St Unit 35B
- 229 Watchung Ave
- 383-387 Broughton Ave
- 387 Broughton Ave
- 51 Sunset Ave
- 23 Mount Vernon Rd
- 118 Byrd Ave
- 29 Newell Dr
- 322 Broughton Ave
- 9 Mount Vernon Rd
- 3 Bellevue Ave
- 3 Collins Ave
- 5 Bellevue Ave
- 428 Essex Ave
- 398 Grove St
- 7 Faber Place
Your Personal Tour Guide
Ask me questions while you tour the home.