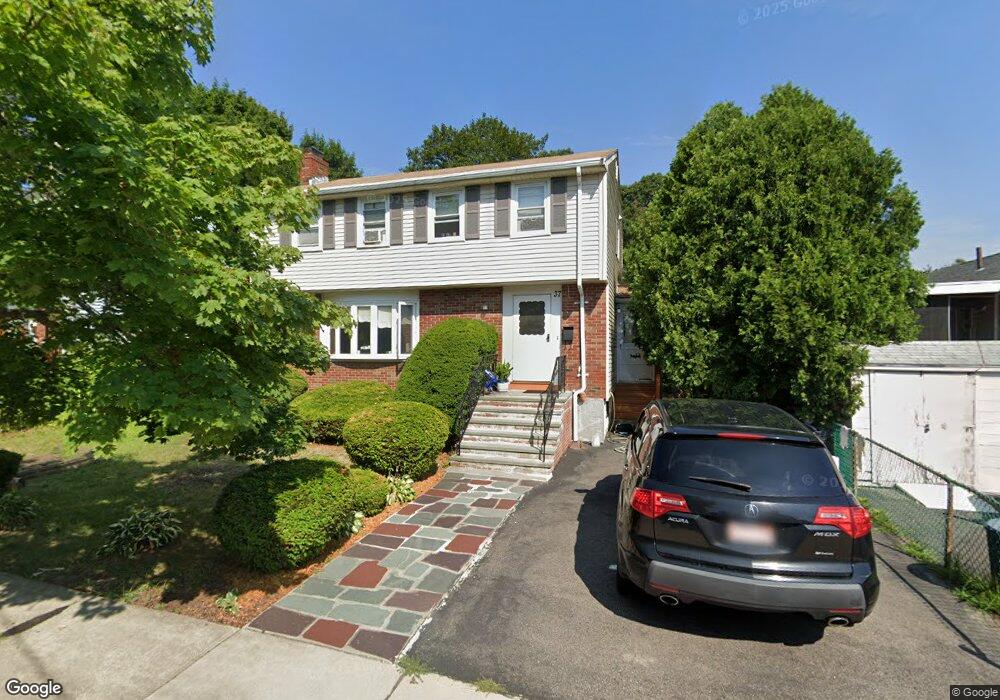
37 Sherbrook St West Roxbury, MA 02132
West Roxbury NeighborhoodEstimated Value: $786,073 - $861,000
4
Beds
2
Baths
1,530
Sq Ft
$534/Sq Ft
Est. Value
About This Home
This home is located at 37 Sherbrook St, West Roxbury, MA 02132 and is currently estimated at $816,768, approximately $533 per square foot. 37 Sherbrook St is a home located in Suffolk County with nearby schools including St Theresa School, Holy Name Parish School, and The Roxbury Latin School.
Ownership History
Date
Name
Owned For
Owner Type
Purchase Details
Closed on
Nov 26, 2003
Sold by
Lynch Margaret T
Bought by
Pang Macfranky and Pang Joyce Y
Current Estimated Value
Home Financials for this Owner
Home Financials are based on the most recent Mortgage that was taken out on this home.
Original Mortgage
$200,000
Outstanding Balance
$94,033
Interest Rate
6.09%
Mortgage Type
Purchase Money Mortgage
Estimated Equity
$722,735
Create a Home Valuation Report for This Property
The Home Valuation Report is an in-depth analysis detailing your home's value as well as a comparison with similar homes in the area
Home Values in the Area
Average Home Value in this Area
Purchase History
| Date | Buyer | Sale Price | Title Company |
|---|---|---|---|
| Pang Macfranky | $405,000 | -- |
Source: Public Records
Mortgage History
| Date | Status | Borrower | Loan Amount |
|---|---|---|---|
| Open | Pang Macfranky | $200,000 | |
| Previous Owner | Pang Macfranky | $10,230 |
Source: Public Records
Tax History
| Year | Tax Paid | Tax Assessment Tax Assessment Total Assessment is a certain percentage of the fair market value that is determined by local assessors to be the total taxable value of land and additions on the property. | Land | Improvement |
|---|---|---|---|---|
| 2025 | $7,975 | $688,700 | $230,200 | $458,500 |
| 2024 | $6,928 | $635,600 | $230,400 | $405,200 |
| 2023 | $6,502 | $605,400 | $219,500 | $385,900 |
| 2022 | $5,987 | $550,300 | $199,500 | $350,800 |
| 2021 | $5,699 | $534,100 | $195,600 | $338,500 |
| 2020 | $5,202 | $492,600 | $175,900 | $316,700 |
| 2019 | $4,943 | $469,000 | $149,300 | $319,700 |
| 2018 | $4,551 | $434,300 | $149,300 | $285,000 |
| 2017 | $4,507 | $425,600 | $149,300 | $276,300 |
| 2016 | $4,545 | $413,200 | $149,300 | $263,900 |
| 2015 | $4,584 | $378,500 | $162,600 | $215,900 |
| 2014 | $4,491 | $357,000 | $162,600 | $194,400 |
Source: Public Records
Map
Nearby Homes
- 183 Temple St
- 481 Lagrange St
- 42 Sanborn Ave
- 99 Vermont St
- 990 Vfw Pkwy Unit 204
- 76 Vermont St
- 34 Addington Rd
- 84 Hastings St
- 425 Lagrange St Unit 203
- 7 Long Terrace
- 1216 Vfw Pkwy Unit 40
- 1210 Vfw Pkwy Unit 11
- 17 Hastings St Unit 4
- 154 Brook Farm Rd
- 37 Pomfret St
- 95 Landseer St
- 116 Spring St Unit A8
- 116 Spring St Unit D2
- 89 Newfield St
- 15 Cass St Unit 3
Your Personal Tour Guide
Ask me questions while you tour the home.