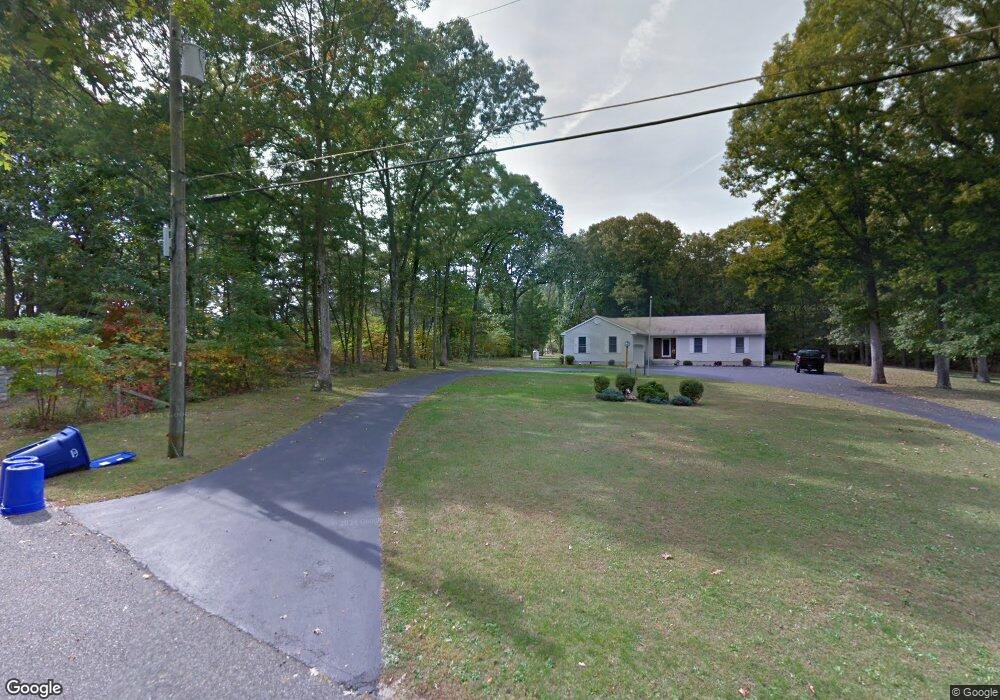
37 Wynn Rd Tabernacle, NJ 08088
Estimated Value: $445,240 - $571,000
Studio
--
Bath
1,802
Sq Ft
$273/Sq Ft
Est. Value
About This Home
This home is located at 37 Wynn Rd, Tabernacle, NJ 08088 and is currently estimated at $492,060, approximately $273 per square foot. 37 Wynn Rd is a home located in Burlington County with nearby schools including Tabernacle Elementary School, Kenneth R Olson Mid School, and Seneca High School.
Ownership History
Date
Name
Owned For
Owner Type
Purchase Details
Closed on
Sep 15, 2003
Sold by
Recupido Donald R
Bought by
Murphy Jennifer J
Current Estimated Value
Home Financials for this Owner
Home Financials are based on the most recent Mortgage that was taken out on this home.
Original Mortgage
$235,600
Outstanding Balance
$103,476
Interest Rate
5.47%
Mortgage Type
Purchase Money Mortgage
Estimated Equity
$388,584
Create a Home Valuation Report for This Property
The Home Valuation Report is an in-depth analysis detailing your home's value as well as a comparison with similar homes in the area
Home Values in the Area
Average Home Value in this Area
Purchase History
| Date | Buyer | Sale Price | Title Company |
|---|---|---|---|
| Murphy Jennifer J | $248,000 | Collegiate Title Corp |
Source: Public Records
Mortgage History
| Date | Status | Borrower | Loan Amount |
|---|---|---|---|
| Open | Murphy Jennifer J | $235,600 |
Source: Public Records
Tax History
| Year | Tax Paid | Tax Assessment Tax Assessment Total Assessment is a certain percentage of the fair market value that is determined by local assessors to be the total taxable value of land and additions on the property. | Land | Improvement |
|---|---|---|---|---|
| 2025 | $6,945 | $209,700 | $57,200 | $152,500 |
| 2024 | $6,362 | $209,700 | $57,200 | $152,500 |
| 2023 | $6,362 | $209,700 | $57,200 | $152,500 |
| 2022 | $6,169 | $209,700 | $57,200 | $152,500 |
| 2021 | $6,278 | $209,700 | $57,200 | $152,500 |
| 2020 | $6,360 | $209,700 | $57,200 | $152,500 |
| 2019 | $6,169 | $209,700 | $57,200 | $152,500 |
| 2018 | $6,056 | $209,700 | $57,200 | $152,500 |
| 2017 | $6,018 | $209,700 | $57,200 | $152,500 |
| 2016 | $5,832 | $209,700 | $57,200 | $152,500 |
| 2015 | $5,781 | $209,700 | $57,200 | $152,500 |
| 2014 | $5,553 | $209,700 | $57,200 | $152,500 |
Source: Public Records
Map
Nearby Homes
Your Personal Tour Guide
Ask me questions while you tour the home.