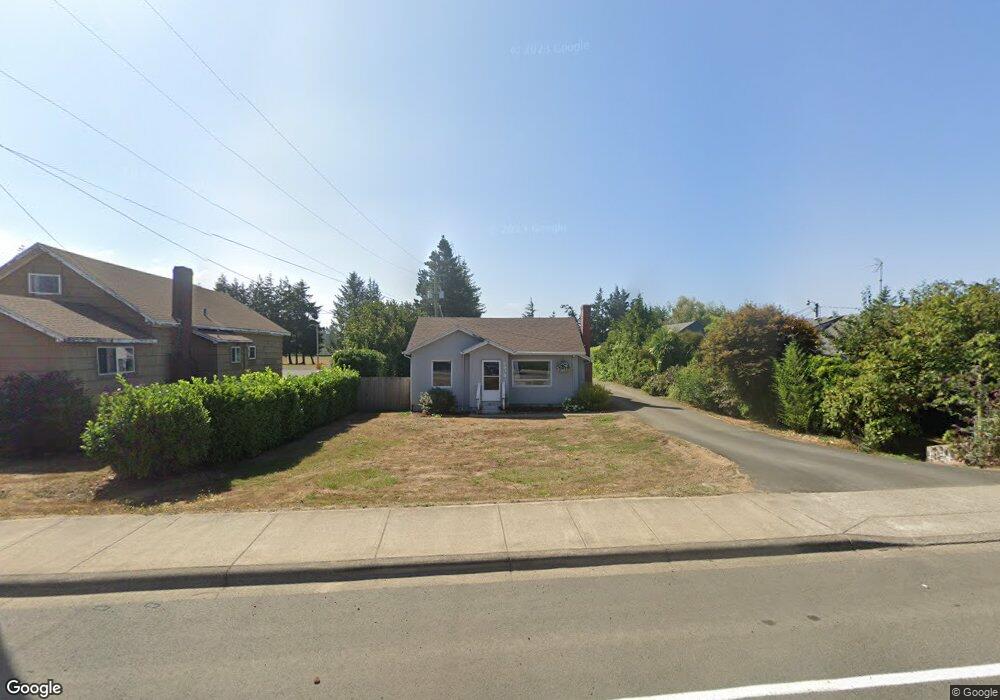
3701 3rd St Tillamook, OR 97141
Estimated Value: $289,848 - $345,000
2
Beds
1
Bath
1,376
Sq Ft
$231/Sq Ft
Est. Value
About This Home
This home is located at 3701 3rd St, Tillamook, OR 97141 and is currently estimated at $317,462, approximately $230 per square foot. 3701 3rd St is a home located in Tillamook County with nearby schools including Tillamook High School, Tillamook Adventist School, and Pacific Christian School.
Ownership History
Date
Name
Owned For
Owner Type
Purchase Details
Closed on
Jan 19, 2006
Sold by
Eiler Kenneth S
Bought by
Phillips Daniel J and Phillips Laura Lynn
Current Estimated Value
Home Financials for this Owner
Home Financials are based on the most recent Mortgage that was taken out on this home.
Original Mortgage
$108,000
Outstanding Balance
$59,687
Interest Rate
6.28%
Mortgage Type
Fannie Mae Freddie Mac
Estimated Equity
$257,775
Create a Home Valuation Report for This Property
The Home Valuation Report is an in-depth analysis detailing your home's value as well as a comparison with similar homes in the area
Home Values in the Area
Average Home Value in this Area
Purchase History
| Date | Buyer | Sale Price | Title Company |
|---|---|---|---|
| Phillips Daniel J | $135,000 | None Available |
Source: Public Records
Mortgage History
| Date | Status | Borrower | Loan Amount |
|---|---|---|---|
| Open | Phillips Daniel J | $108,000 |
Source: Public Records
Tax History
| Year | Tax Paid | Tax Assessment Tax Assessment Total Assessment is a certain percentage of the fair market value that is determined by local assessors to be the total taxable value of land and additions on the property. | Land | Improvement |
|---|---|---|---|---|
| 2025 | $1,505 | $124,710 | $52,860 | $71,850 |
| 2024 | $1,430 | $121,080 | $51,320 | $69,760 |
| 2023 | $1,417 | $117,560 | $49,830 | $67,730 |
| 2022 | $1,369 | $114,140 | $48,380 | $65,760 |
| 2021 | $1,328 | $110,820 | $46,970 | $63,850 |
| 2020 | $1,292 | $107,600 | $45,600 | $62,000 |
| 2019 | $1,259 | $104,470 | $44,280 | $60,190 |
| 2018 | $1,227 | $101,430 | $42,990 | $58,440 |
| 2017 | $1,196 | $98,480 | $41,740 | $56,740 |
| 2016 | $1,152 | $95,620 | $40,520 | $55,100 |
| 2015 | $1,128 | $92,840 | $39,340 | $53,500 |
| 2014 | $1,110 | $90,140 | $38,190 | $51,950 |
| 2013 | -- | $87,520 | $37,080 | $50,440 |
Source: Public Records
Map
Nearby Homes
- 3608 Alder Ln
- 509 Williams Ave
- 3810 3rd St
- 3413 Maple Ln
- 4005 Elmwood St
- 4204 Dogwood Ave
- 1110 Meadow Ave
- 409 Del Monte Ave
- V/L Marolf Loop Rd
- 411 Park Ave
- TL#02600 12th St
- 2505 1st St
- 2506 1st St
- 2418 1st St
- 2410 3rd St
- Parcel 1 Wilson River Hwy
- Parcel 2 Wilson River Hwy
- TL# 02100 Wilson River Hwy
- 00201 Wilson River Hwy
- 903 Madrona Ave
- 3703 3rd St
- 307 Linden Dr
- 301 Linden Dr
- 311 Linden Dr
- 315 Linden Dr
- 3605 3rd St
- 3709 3rd St
- 3603 3rd St
- 0 Alder Ln Unit 24402052
- 0 Alder Ln Unit 12445404
- 0 Alder Ln Unit 13060384
- 0 Alder Ln Unit 2
- 306 Linden Dr
- 3515 3rd St
- 312 Linden Dr
- 401 Linden Dr
- 3713 3rd St
- 3604 Alder Ln
- 3606 Alder Ln
- 3513 3rd St
Your Personal Tour Guide
Ask me questions while you tour the home.